The first Lumber graph below shows the long-term trend back to 1984 and the second graph shows the 12-month price action.
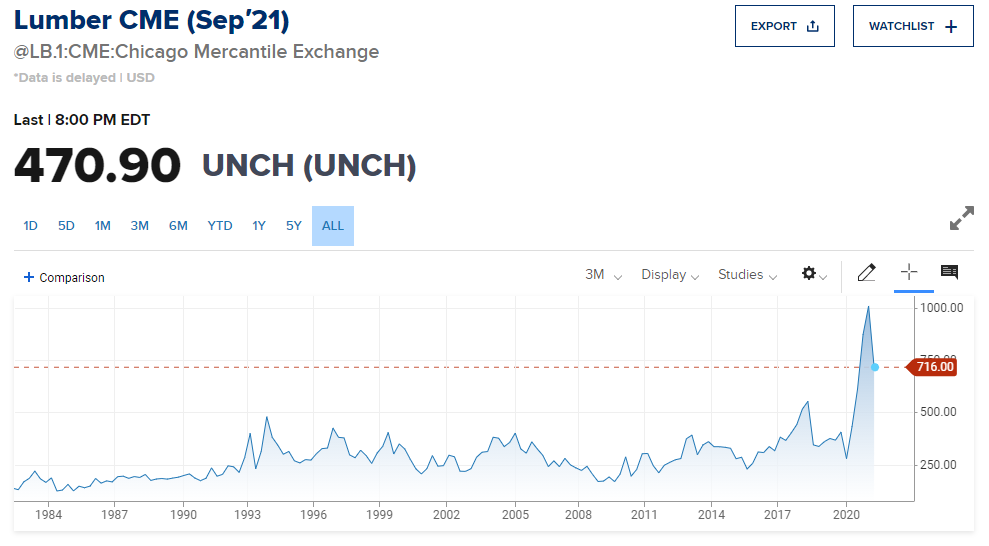
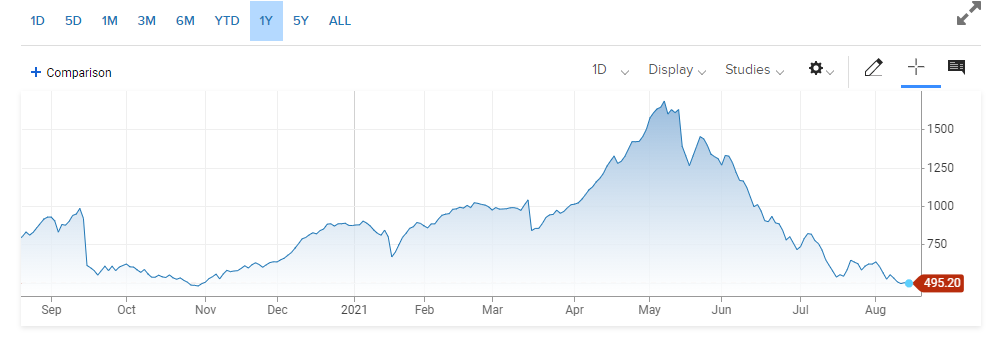
The first Lumber graph below shows the long-term trend back to 1984 and the second graph shows the 12-month price action.
Level 17 Chifley Tower
2 Chifley Square
Sydney, NSW 2000
1300 614 002
Investor Signals Pty Ltd
ABN 44 143 555 453