The Week Ahead: May 4 – May 8, 2026
The Week Ahead: May 4 – May 8, 2026
The upcoming week will be dominated by central bank policy and the tail-end of the US earnings season. Investors should focus on the following key events:
1. Macro Data and Central Banks
- RBA Interest Rate Decision: The market is bracing for a possible 25 basis point (bps) rate hike from the Reserve Bank next week. Persistent cost pressures and the March inflation print of 4.6% have led analysts to forecast that rates could rise to 4.60% by September 2026.
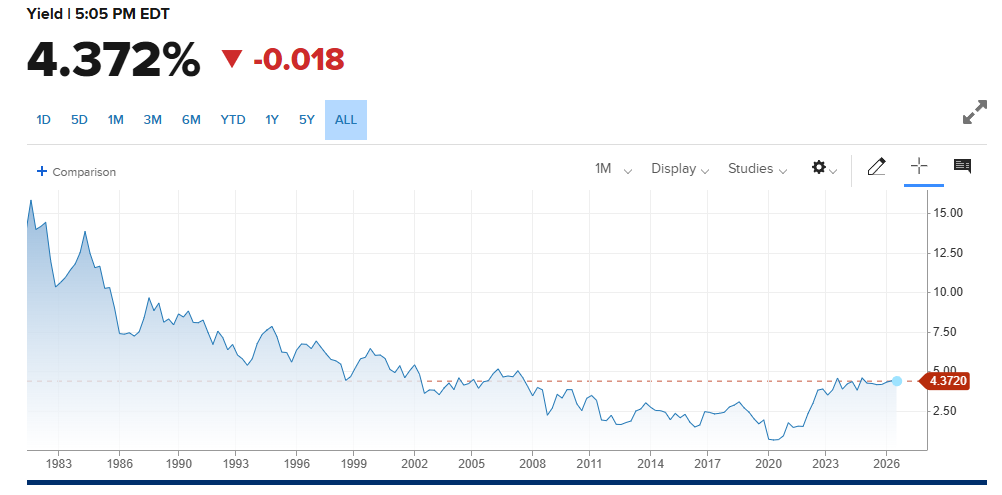
- US Fed Watch: With the Fed Funds Interest Rate currently at 3.75%, any commentary following the recent PCE data will be scrutinized for signs of a pivot or continued pause.
2. Company Events and Earnings
ASX Resource Reports: Following BHP’s recent Quarterly Activities Report, market participants will be looking for production guidance updates from mid-tier miners as commodity price volatility continues.
US Earnings: The earnings season continues with key players in the energy and consumer discretionary sectors scheduled to report. The focus will remain on whether corporate margins can continue to withstand higher interest costs.