Ansell – Trade
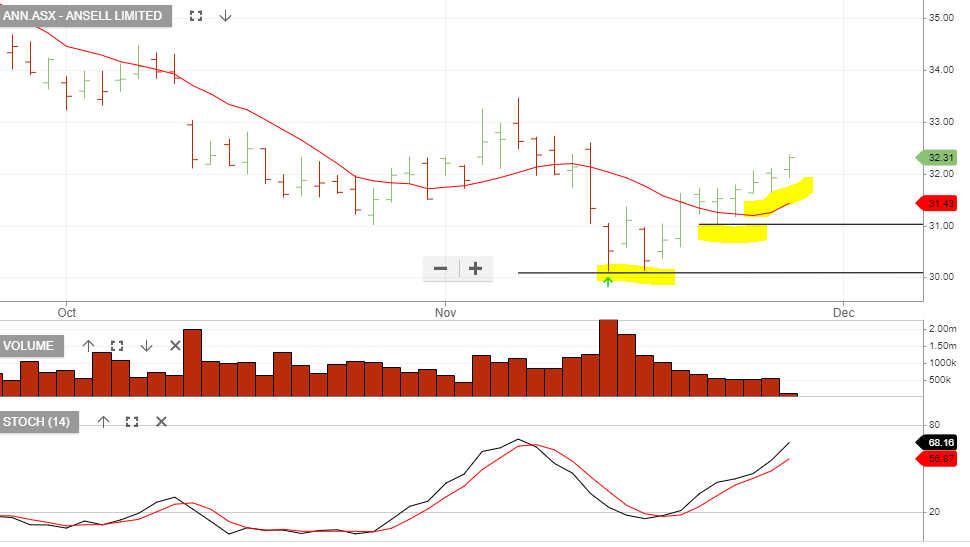
The Ansell trade from Monday night’s webinar is starting to build momentum. We entered the trade as a counter-trend position as the price action crossed above the 10-day average.
The Ansell trade from Monday night’s webinar is starting to build momentum. We entered the trade as a counter-trend position as the price action crossed above the 10-day average.
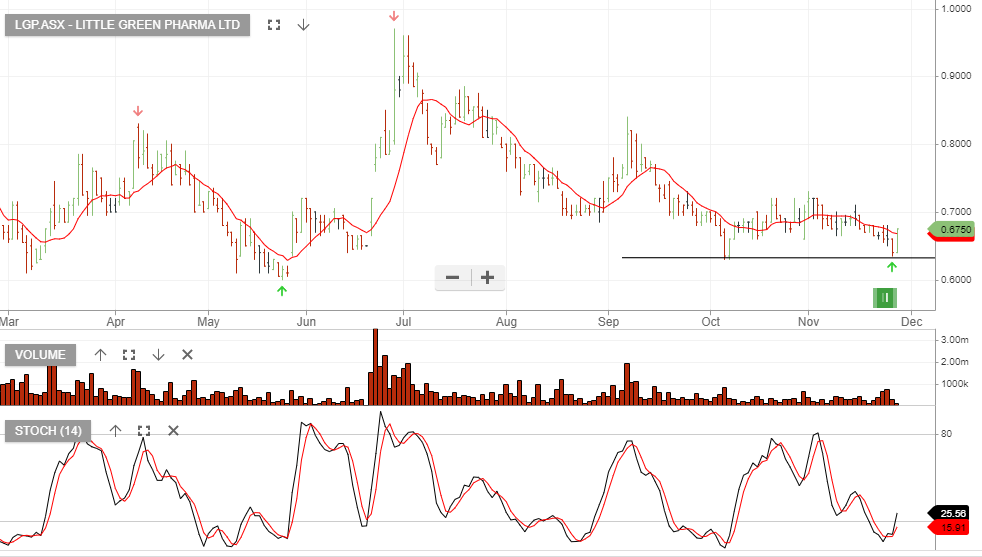
Little Green Pharma is now under Algo Engine buy conditions.
Little Green Pharma is a pioneer and innovator in Australian-grown, manufactured and exported medicinal cannabis.
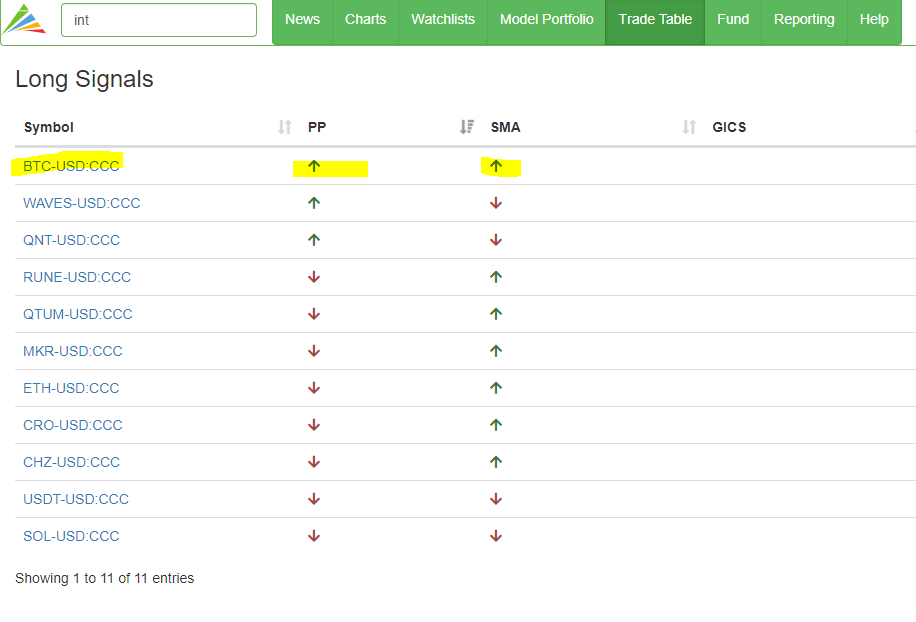
The Trade Table which is only available in the Pro version shows that Bitcoin is now an open short-term trade. The holding duration will likely be days not months or years for this strategy. Remember, the Trade Table is different from the Model Portfolio, Bitcoin could stay in the model portfolio for months or years.
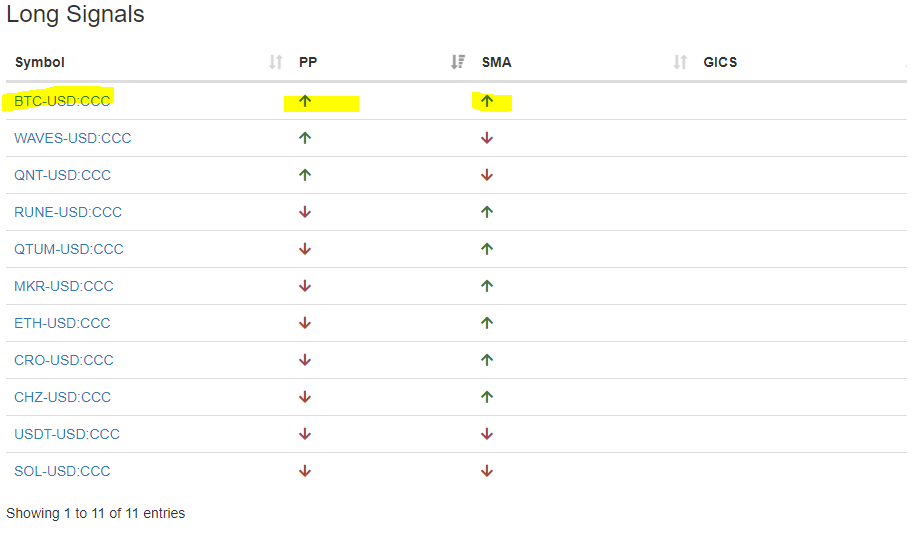
The Trade Table is for traders who are looking for quick in and out. The double green arrows under “Long Signals” indicate the trade is now open.
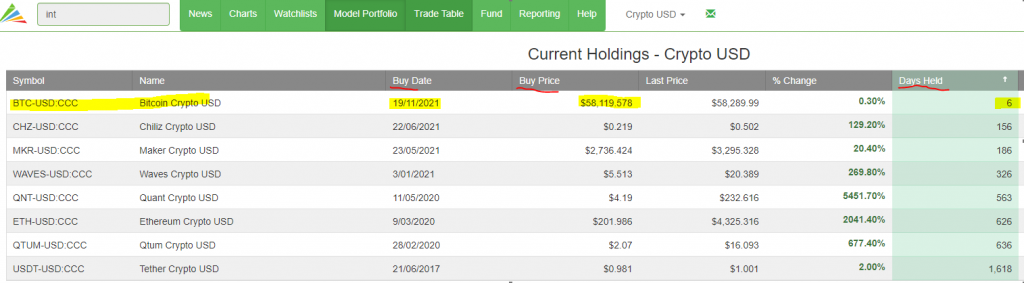
To further explain the recent activity in Bitcoin and the difference between the inclusion in the Model Portfolio versus the overnight Trade Table set up. Bitcoin was added to our “model portfolio” 6 days ago and coin investors will hold BTC for months or years, as instructed by the algo engine.
Whereas traders will be following the Trade Table as well, looking for a quick in and out over a few days. The Long Signals mean these coins are under “algo engine” buy conditions and the double green arrows mean the short-term trade is now on. The switch to double green arrows has occurred overnight.
So, it’s a buy today, and hold the position until the SMA arrow turns red.
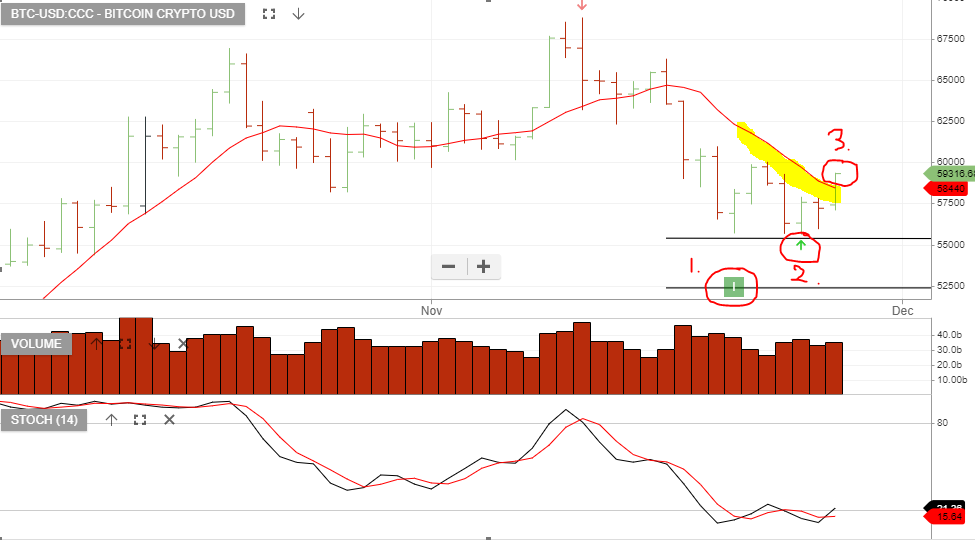
Another way of expressing this is through the charts. The 1,2 and 3 set up shows the conditions being met in order for the Trade Table to display the dual green arrows. Should the price action move back below the red line, (10-day average) the trade will be closed and the SMA column in the Trade Table will shift to a red down arrow. For now, the buy trade is open and we’ll look for additional buying momentum to start building, helping to keep BTC above the 10 day average.
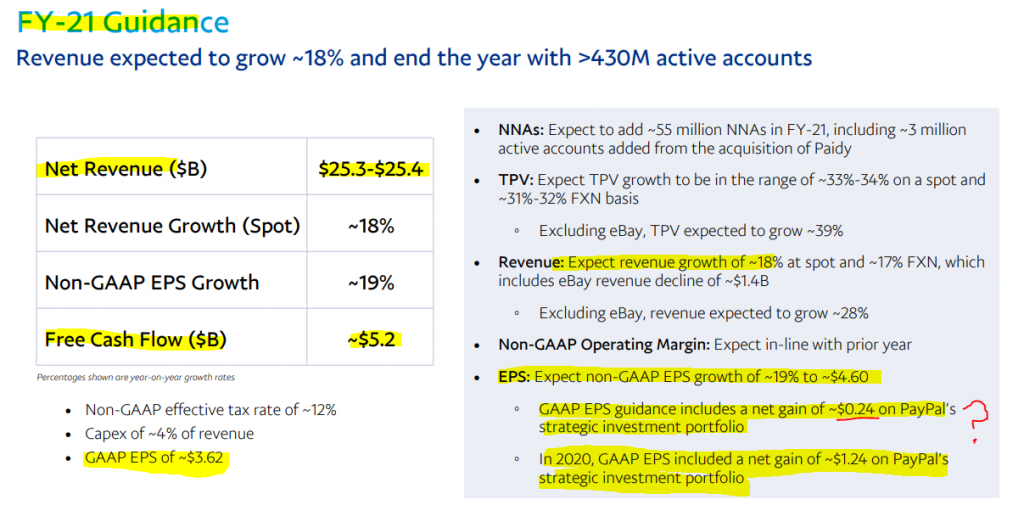
PayPal Holdings, Inc. – Common is a current holding in our US model portfolio. The stock is up 10% since being added last year and the current sell-off provides another entry opportunity.
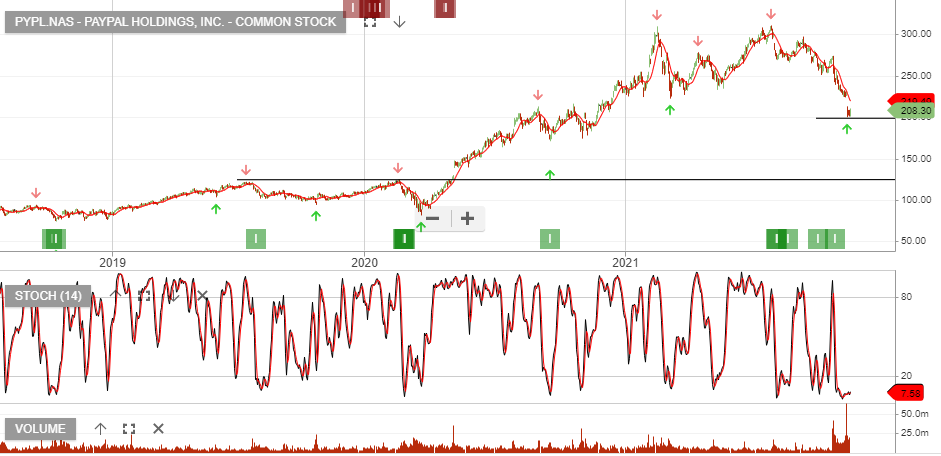
20/11 update: Paypal remains below the 10-day average and we encourage traders interested in US stocks to track the price action, as a powerful price reversal is likely.
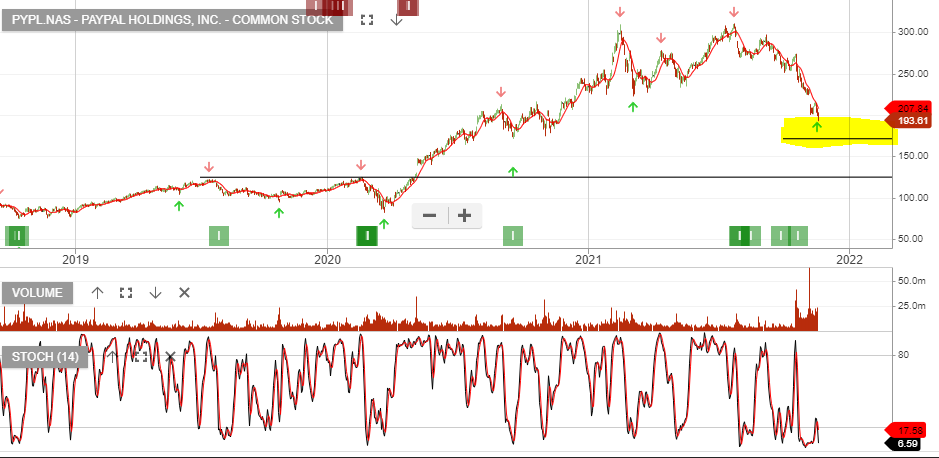
26/11 update:
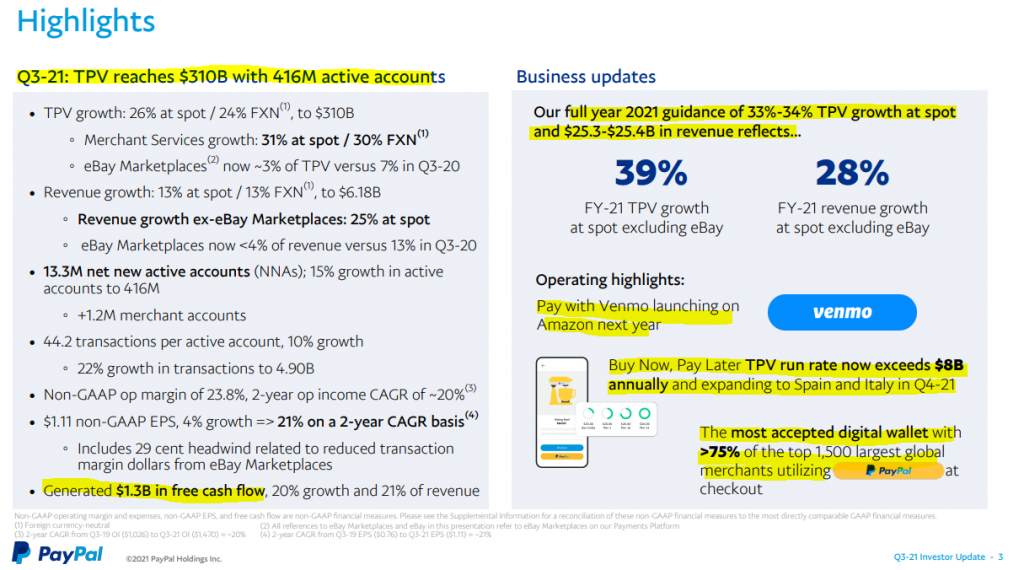
PayPal is an opportunity to accumulate within the $150 – $180 price range. The selloff reflects a correction in the PE ratio from 80x to 40x and the investment is a bet on continued growth and a responsive reaction from the company to increased competitive threats.
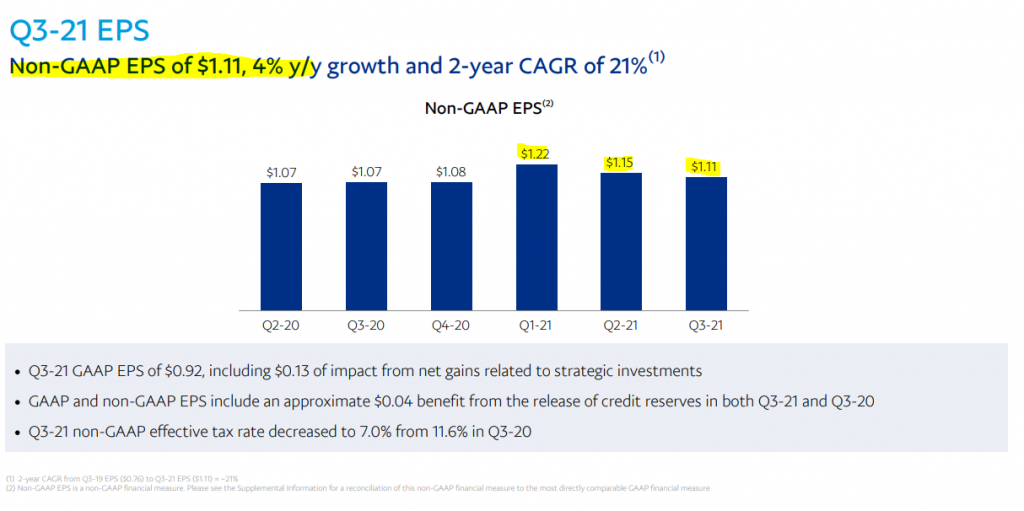
This explains the selloff: 4% EPS growth and the FY21 quarterly trend of lower EPS is a concern. However, we’re positioning on the basis the market is getting overly negative on the stock.
Wait for the price to cross back up through the 10-day average.
Sorry, but this content is restricted to our members.
Please login with your account or register for a free trial. If your trial has expired, then you may renew it here.
If you are having an issue with your account, then please get in touch with us.
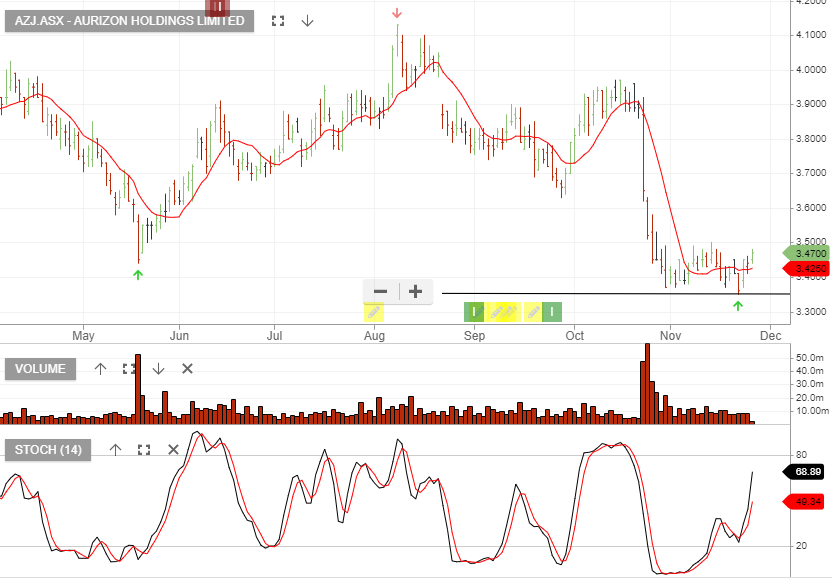
Aurizon Holdings offers value and we expect buying support to build above the $3.35 support level.
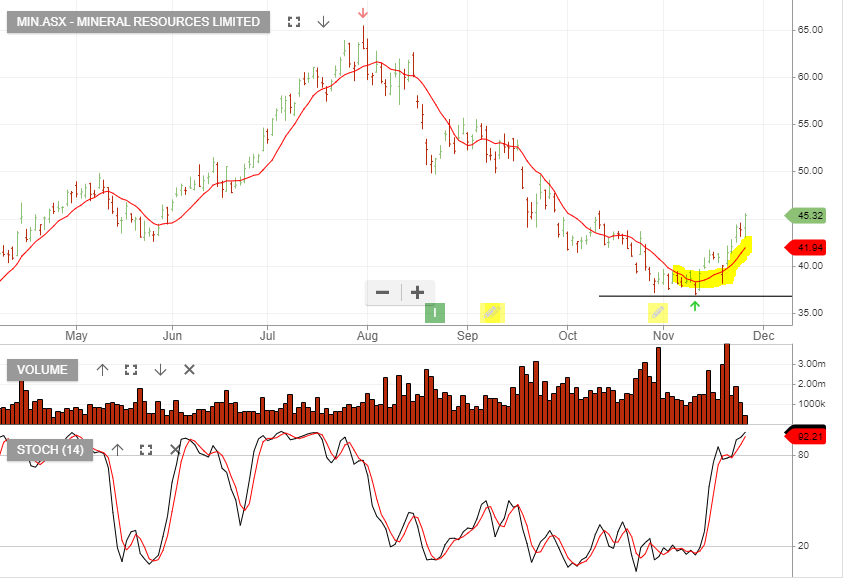
Mineral Resources is under Algo Engine buy conditions and is in our ASX 100 model portfolio.
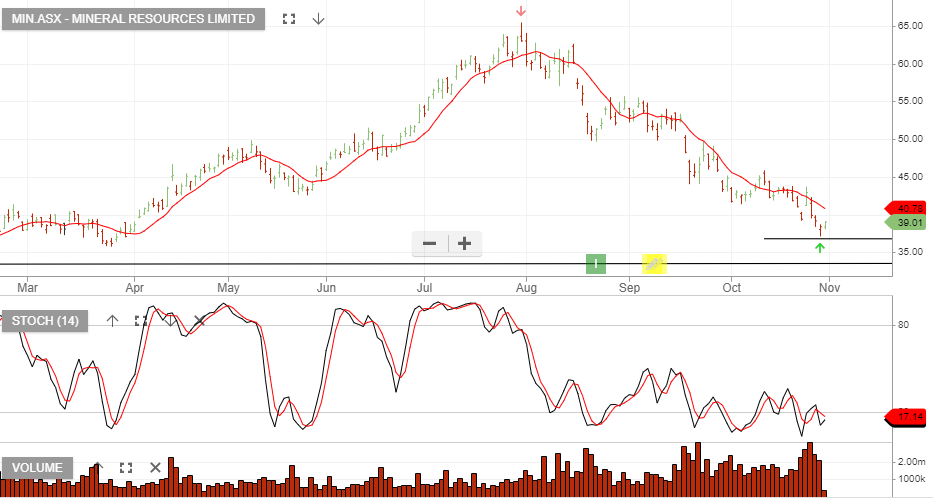
25/11 update: (ASX:MIN} has crossed the 10-day average and is now 10% above the entry-level.
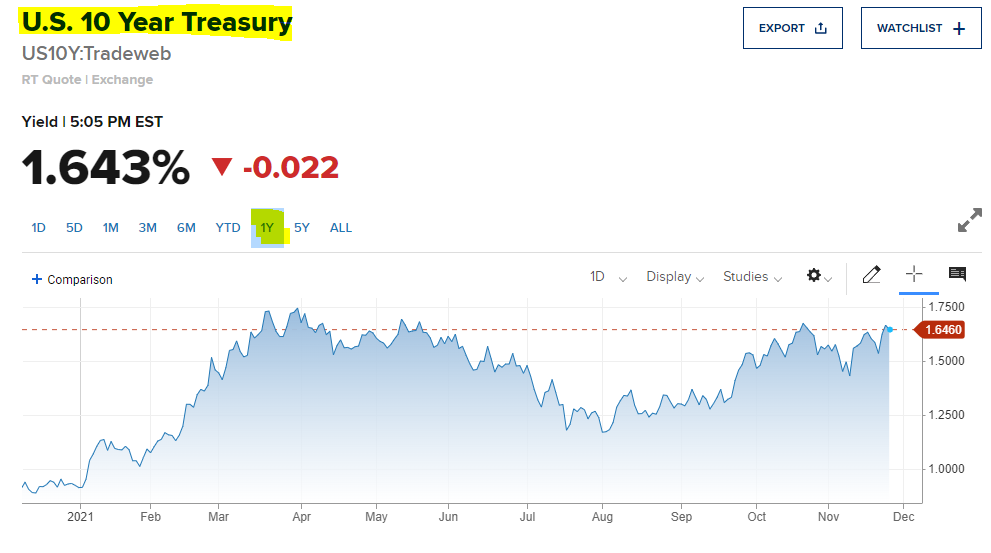
The US Federal Reserve Fed funds rate is currently between zero and 0.25 per cent. QE is being reduced from $US120 billion to $US105 billion a month and then a further reduction to $US90 billion from Jan onwards.
Current market expectations are for the Fed to raise its cash rate from the record low 0.1 per cent level in 2023.
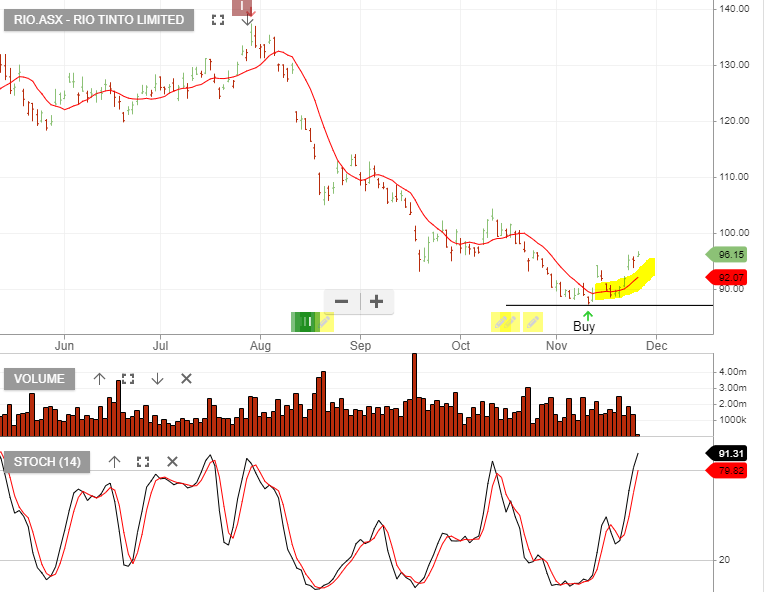
The price of iron ore rose 2.9 per cent to $US102.75. A relaxation of curbs on Chinese property developers, rising margins for steel producers, and signs that Chinese authorities will add fiscal and monetary support look positive for the commodity.
Level 17 Chifley Tower
2 Chifley Square
Sydney, NSW 2000
1300 614 002
Investor Signals Pty Ltd
ABN 44 143 555 453