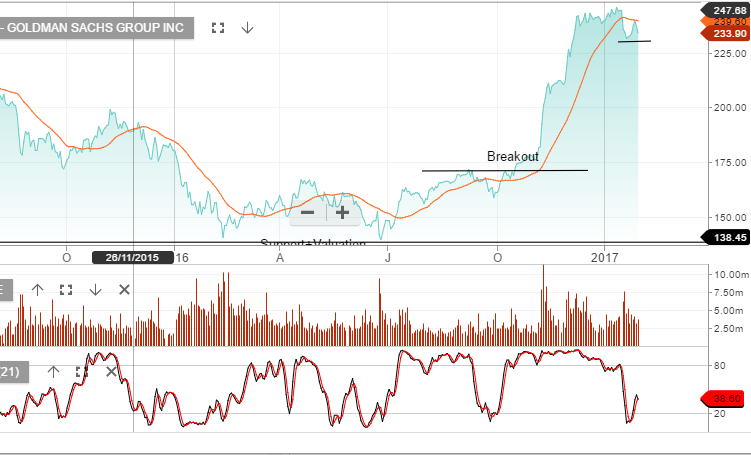
Goldman Sachs was down 2.5% overnight and was among the worst performers within the Dow Jones index of 30 companies. We see support at $230 and resistance at $245. As a gauge to the likely direction of US financials over the March quarter, we think it’s worth keeping an eye on the directional break of Goldman Sachs trading range.

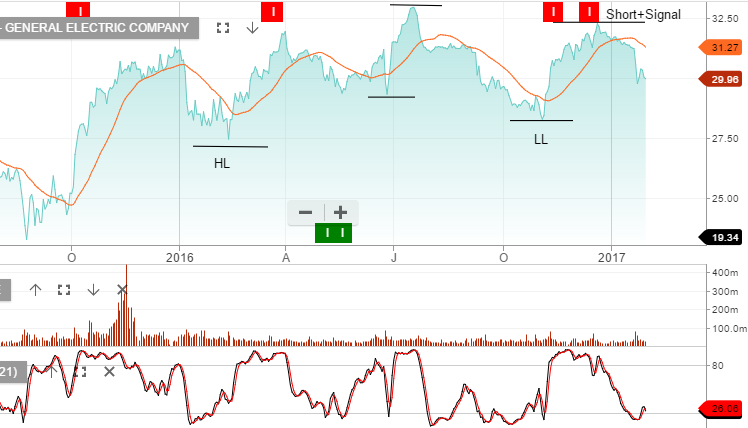
We’re also watching the negative lead from General Electric as the stock trades 10% below the recent high formed on the 20th of December.

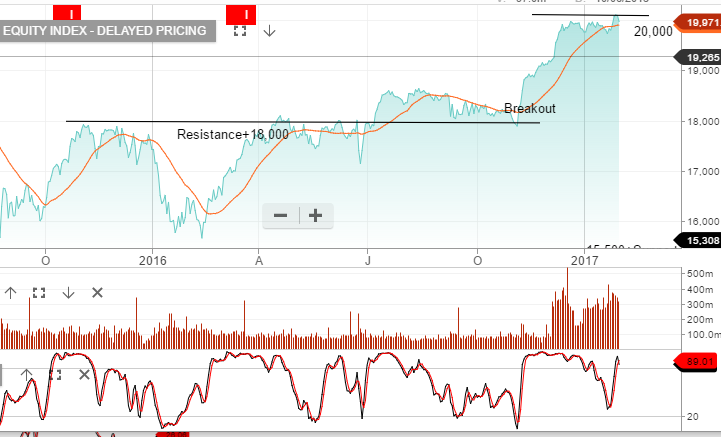
S&P500 earnings need to grow by 10 – 12% over the next 12 months to support the Dow Jones at 20,000. If average EPS tracks at the same rate achieved in 2014, 2015 & 2016, of approximately $120 per share, an argument could be made that the true value for the Dow Jones sits back at 16,500 to 18,000.
