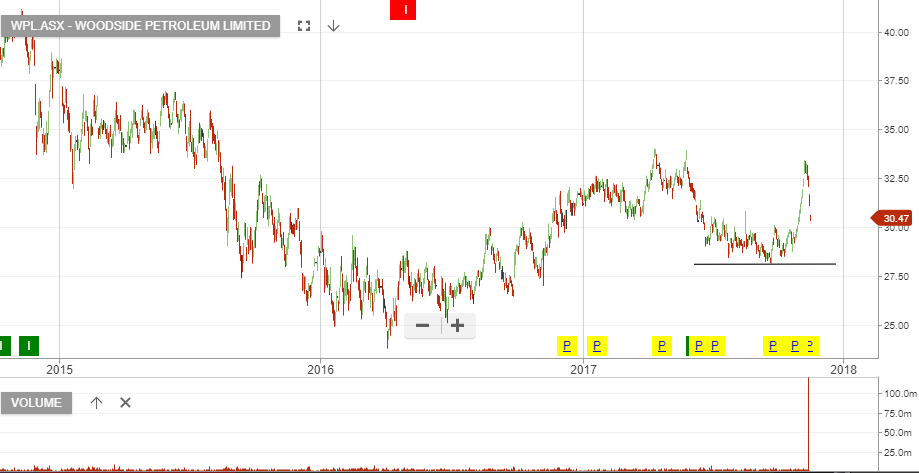
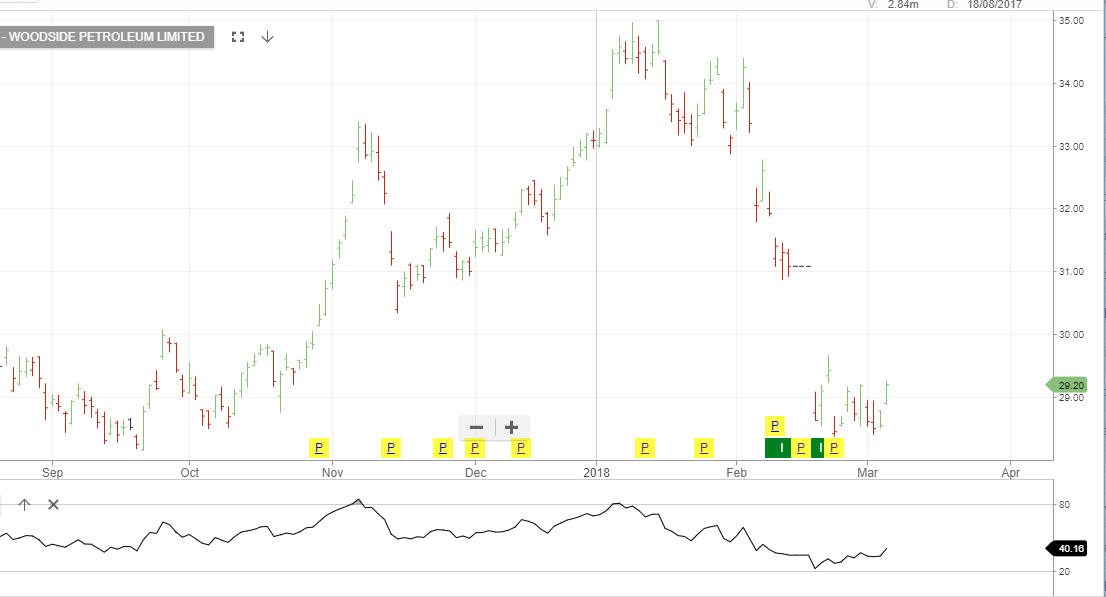
WPL Gets A Boost From WTI
Shares of WPL reached a high of $29.25 in early trade as West Texas Intermediate (WTI) crude oil posted its largest single session gain in over three weeks.
The front month WTI contract rose $1.30, or 2.2%, following a report that crude stocks have dropped by 600,000 barrels at the US storage hub in Cushing, Oklahoma.
WPL is part of our ASX Top 20 Model Portfolio and our ALGO engine triggered a buy signal on February 20th at $29.10.
The stock has been a tepid performer over the last few weeks after announcing a rights issue and going ex-dividend.
However, the technical picture is improving and a break back above the $29.66 level will likely extend into the gap from $30.90 from mid-February.
Woodside Petroleum
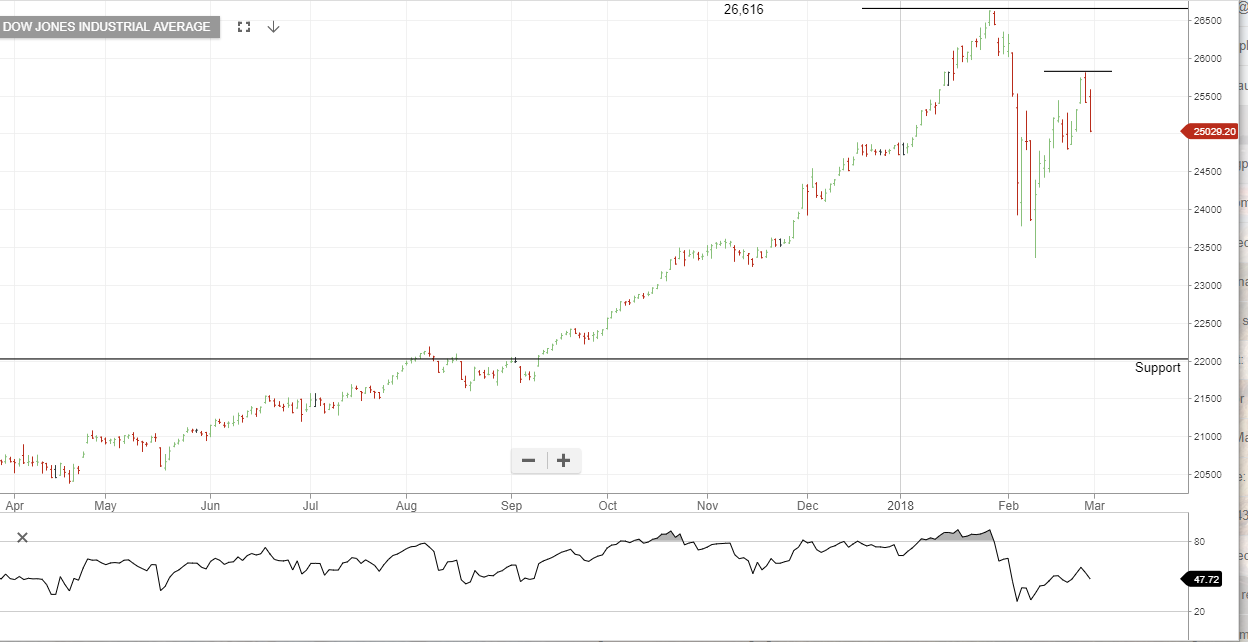
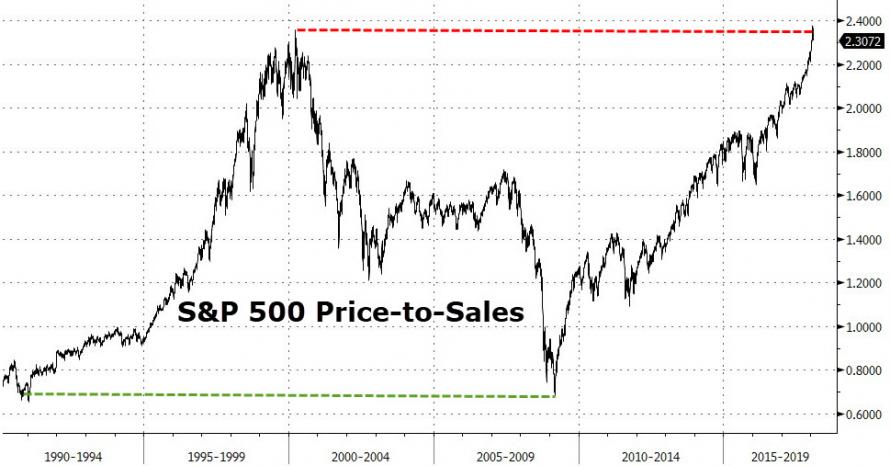 SP 500 Index
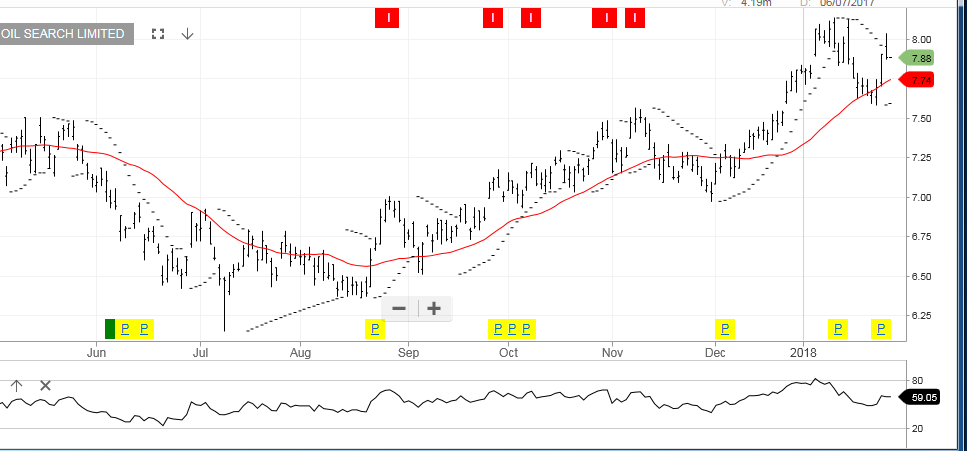 Oil Search