The Next Recession – US March GDP

The next recession will be difficult for Central Banks as already low interest rates, inflated balance sheets & high deficits will likely result in a diminishing effect of policy tools to fight off deflation.

Economy

US GDP has slipped from 2.5% to 0.7% in the March quarter. A long way from the 3.5 or 4% the Trump administration says is achievable. More worrying is GDP appears to be trending lower and now showing only 0.2% growth. The March employment numbers were unexpectedly low, auto sales are dropping due to rising defaults and lenders tightening lending standards. Student loan defaults are rising and mortgage applications are no longer growing.

Many market commentators are dismissing the negative GDP trend as “seasonal issues” and are forecasting a sharp rebound in the June numbers. We’re not so sure and continue to feel that risk assets will soon come under pressure &  portfolios should be defensively positioned.

Markets

The bulls will say, yeah but that doesn’t matter, stock prices are rising S&P500 earnings are growing at an average rate of 6%, (ex-energy), and 11% including the rebound in energy related profits, as oil prices recover from this time last year.

Technology giants Microsoft, Google, Apple, Facebook & Amazon are all delivering tremendous earnings growth and this can’t be denied, however, we’ve seen these names suffer during past recessions. They’re not infallible

Conclusion

With the bulk of the S&P500 delivering minimal top line revenue growth, PE’s expanding in a backdrop of falling GDP and rising bad debts, we feel caution is justified.

Local ASX Instruments to consider BEAR, BBOZ, YANK, BBUS & GOLD ETF’s along with Index XJO Puts . Overweight, healthcare, consumer staples, technology & yield sensitive names.
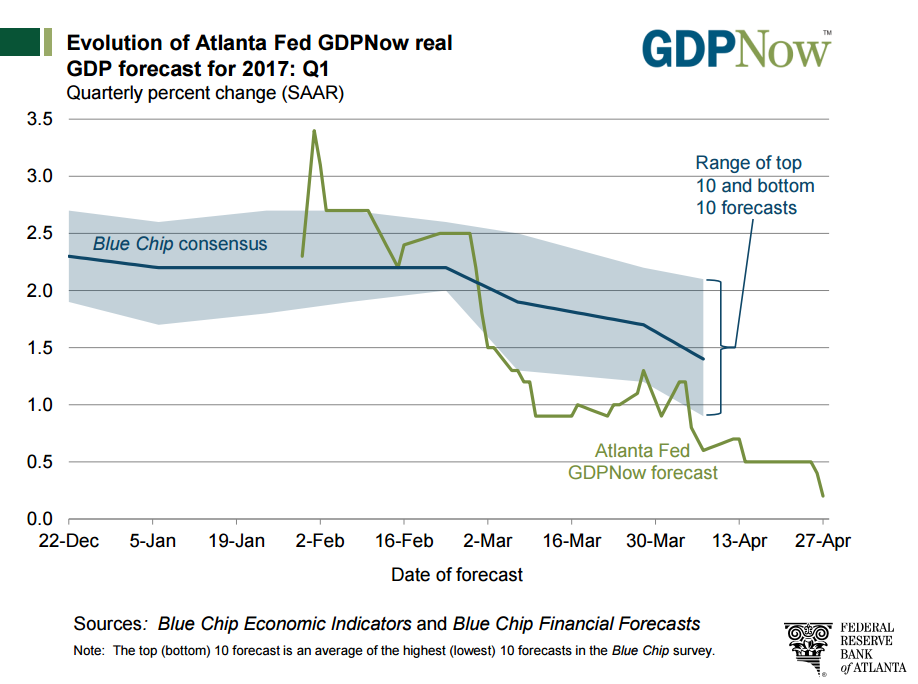
Chart – US GDP Trend
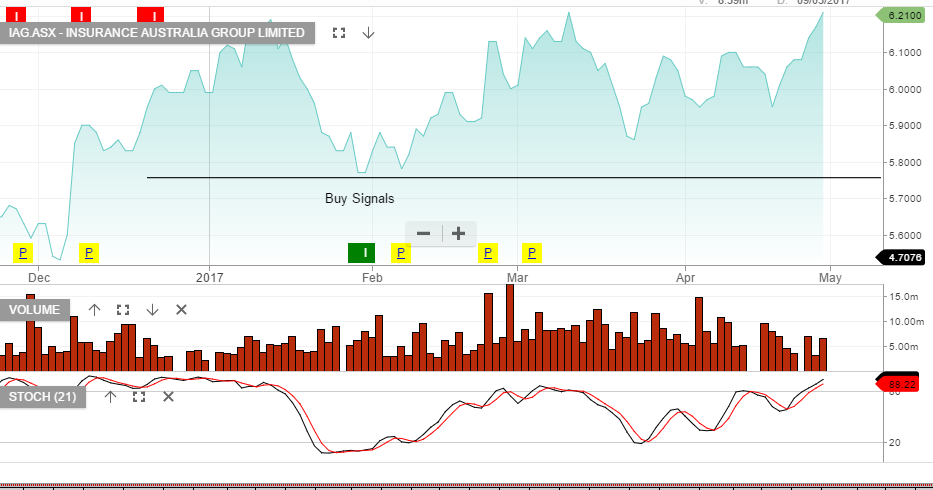
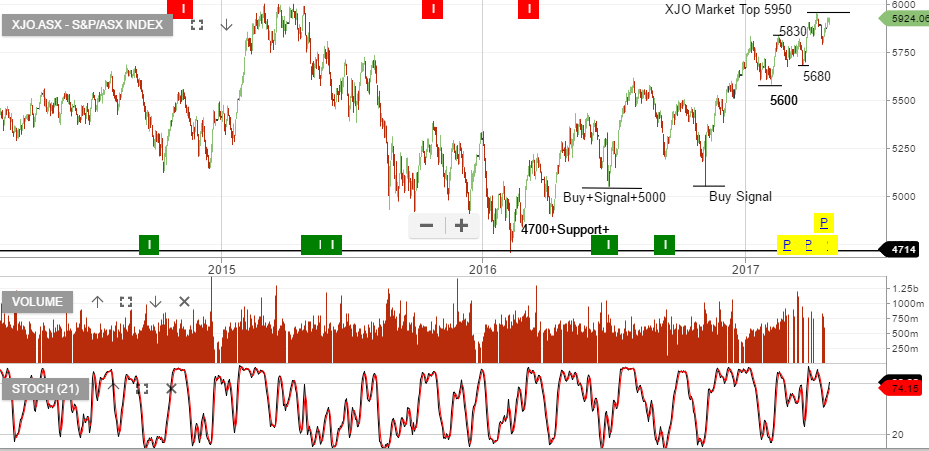
Algo Engine – Open Buy Signals

Below is a list of the current ASX top 50 stocks that have open buy signals from our ALGO engine.

Some of these trends are maturing and are in the latter stages of their price expansion. However, taking the time to look through the charts and overlaying the ALGO Engine signals will be a worthwhile exercise.

TWE, WES, WOW, ALL, ANZ, ASX, AZJ, BHP, CSL, DXS, FMG

GMG, IAG, JHX, MQG, NAB, ORG, ORI, RIO,S32, SCG, SGP & SHL.

If your access to the charts and signals has expired, please contact me leon@investorsignals.com


Algo Engine – Preliminary Research

We have contracted a third-party firm to conduct a study on the ALGO Engine signals and trading model performance.

The preliminary results have supported my assumptions made by following 18 years of practical experience in the markets. The methodologies developed are now being integrated into a model using the following technical principles.

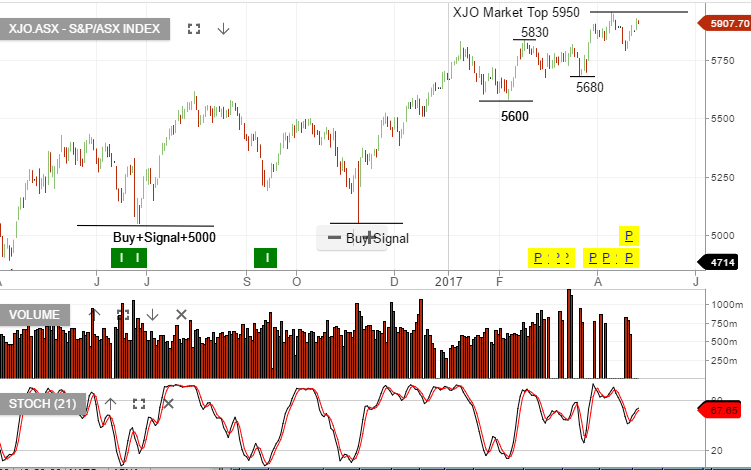
Our Algo Engine is capturing higher low buy points in individual stocks which make up the ASX top 50 index. When the XJO itself is making “higher highs” and “higher lows”, this produces a very high success rate.

Buying into these patterns can keep investors exposed to major bullish momentum without the human emotion of prematurely taking profits on the trade, and importantly,  automating the stop-loss when the upward price momentum begins to reverse.

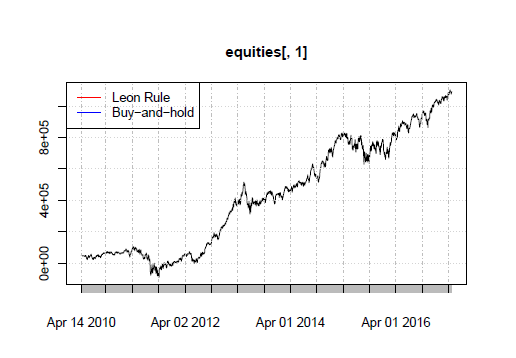
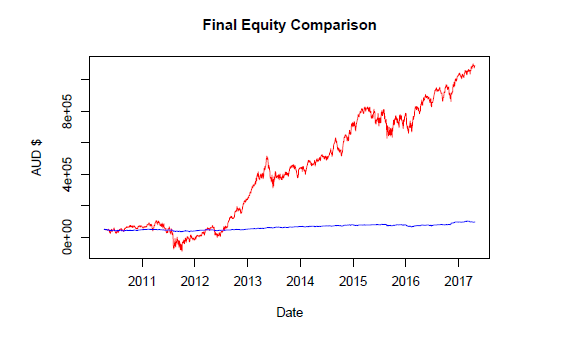
The chart below shows the performance of the “long only” ALGO Engine signals. The model is based on buying $50k in all long signals and holding the long position until a subsequent short or sell signal is triggered.

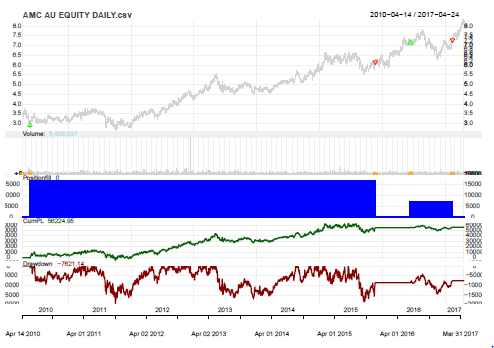
An example of this logic is also displayed on the individual stock sample below using Amcor.

For a comprehensive copy of our preliminary research paper, please contact me on leon@investorsignals.com


Chart – Algo Engine Amcor History
Chart – Algo Engine Equity Return
Chart – Algo Engine XJO Benchmark


IBM -Where is Support

IBM has approximately US$3.8 billion remaining on its current share buy-back plan. Over the last two years, the company has averaged about $4 billion per year in share repurchases .

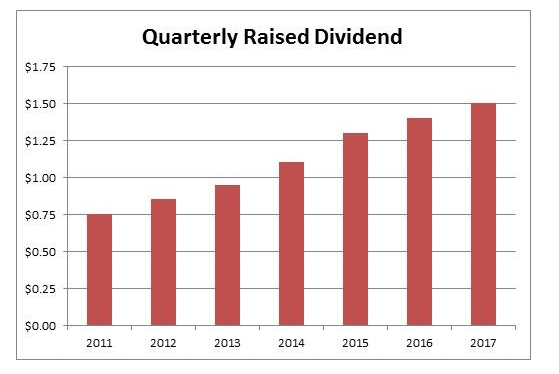
IBM annual yield is now running at around 3.70% or equivalent to US$6.00, that’s well above US Treasuries.

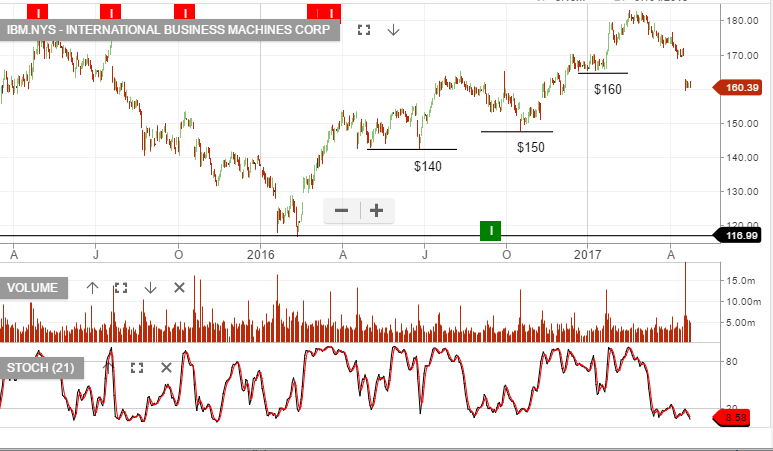
Our Algo Engine generated a buy signal at around $155 back in September last year. Since then, the stock rallied to $183 before last week’s disappointing earnings result caused the stock to sell-off. The price structure looks like we may see a retest of the $150 support level in the near -term. 

Chart – IBM Div History
Charts – IBM


Resmed – Buy the Dip

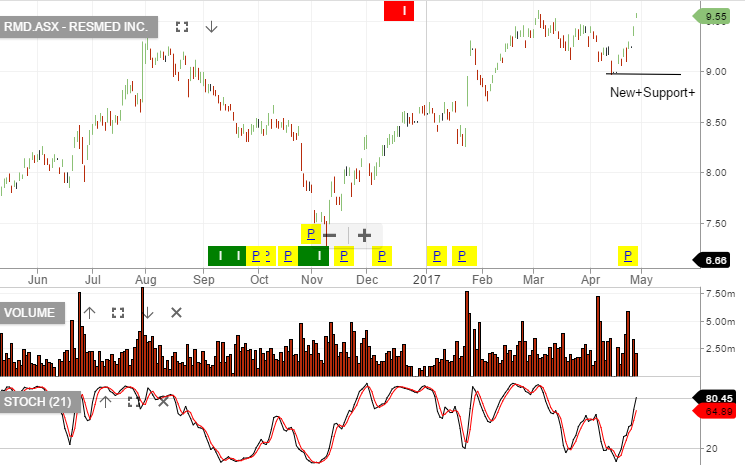
RMD will report their 3QFY17 results on 27th April. Early success of the AirFit 20 series should help to underpin year-on-year underlying earnings growth 15%+ to $US$520m.

FY18 we expect revenue of US$2.3b, EBIT US$580m, (from US$520in FY17), EPS US$3.10 and DPS US$1.45, placing the stock on a forward yeild of 2.1%

We like RMD’s growth outlook and therefore we’re encouraged to buy RMD ahead of the result and to add to the position on price retracements.

To help enhance the yield, we’re selling out-of-money call options, allowing for reasonable capital growth whilst at the same time increasing the cash flow from the dividend and call option income to over 10% p/a.

Chart – RMD


Australian Bank Earnings

On 2nd May, ANZ will report their half-year earnings. The market is expecting a net profit of around $3.7b and DPS for the half year of $0.80.

4th May, NAB will report their half-year earnings.  Net profit should be around $3.4b and DPS of $1.00.

5th May, Macquarie Bank reports. Net profit is expected to be similar to last year at $2.15b and DPS of $2.52

8th May, WBC report their half-year result. Net profit should be $4b and DPS $0.95

On average, the market is looking for approximately 3% underlying EPS growth among the banks and dividends to remain steady, or the same as the previous 12 months.

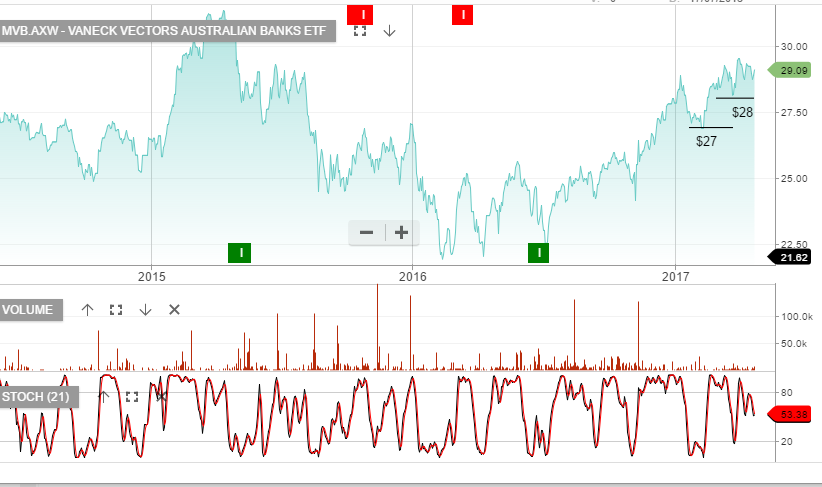
Charts – MVB (Vaneck Aust Bank ETF)