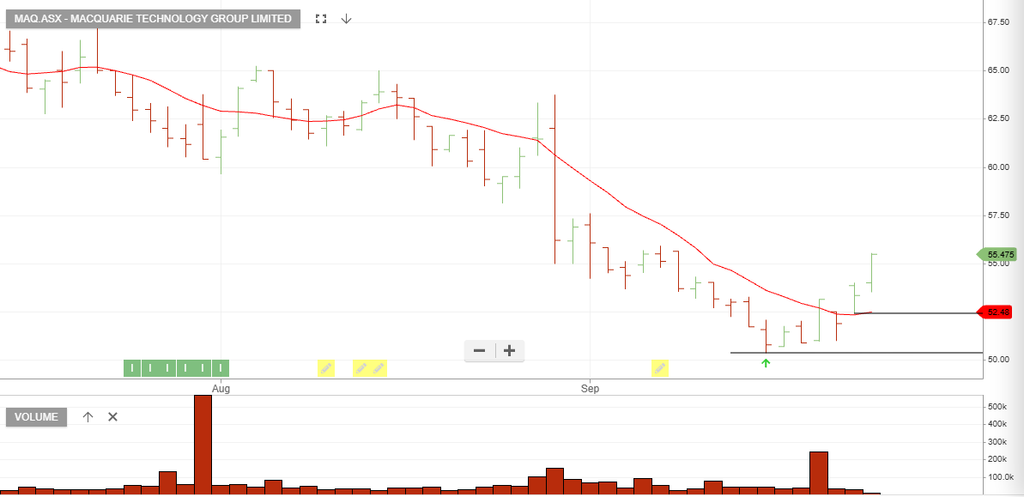
Macquarie Technology
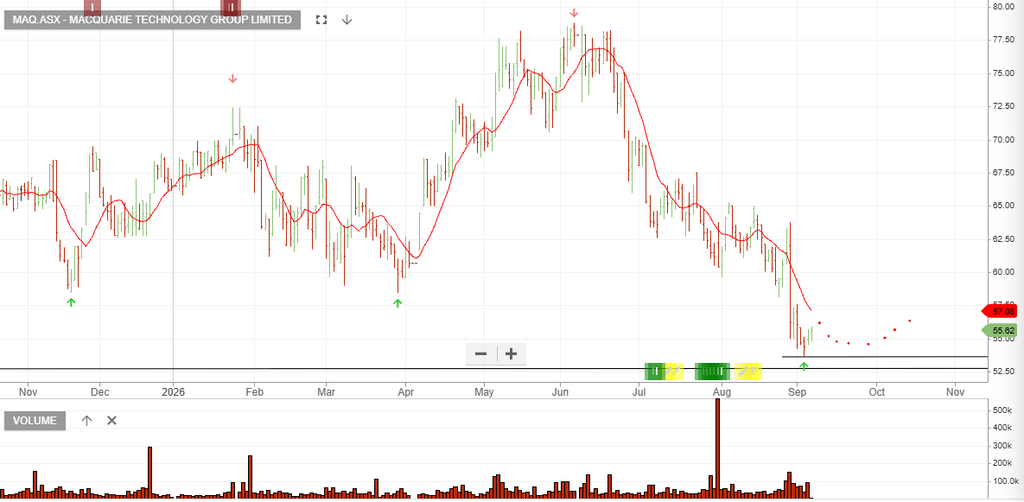
Macquarie Tech
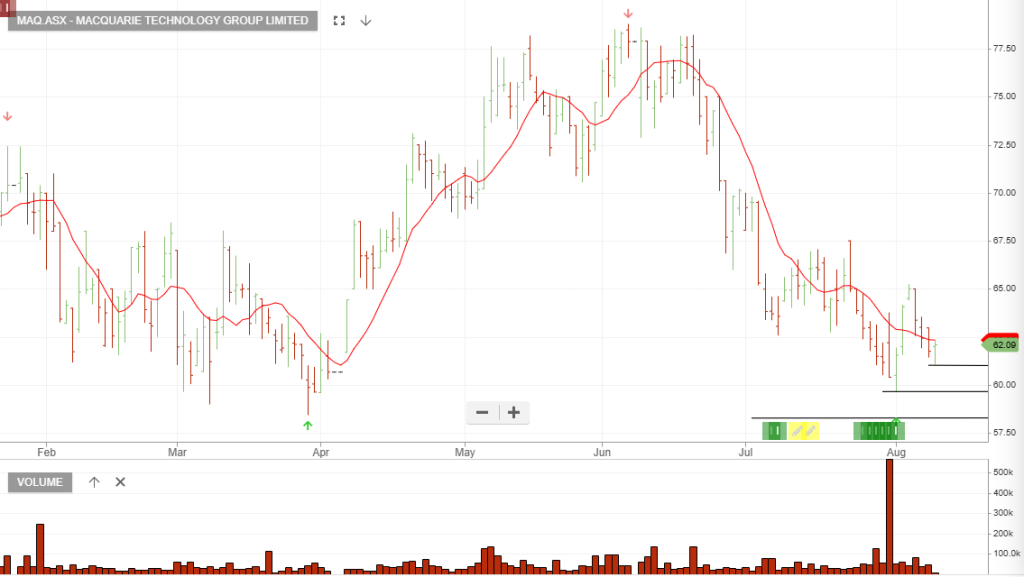
Update 14/8: Buy and place the stop loss at $61.09
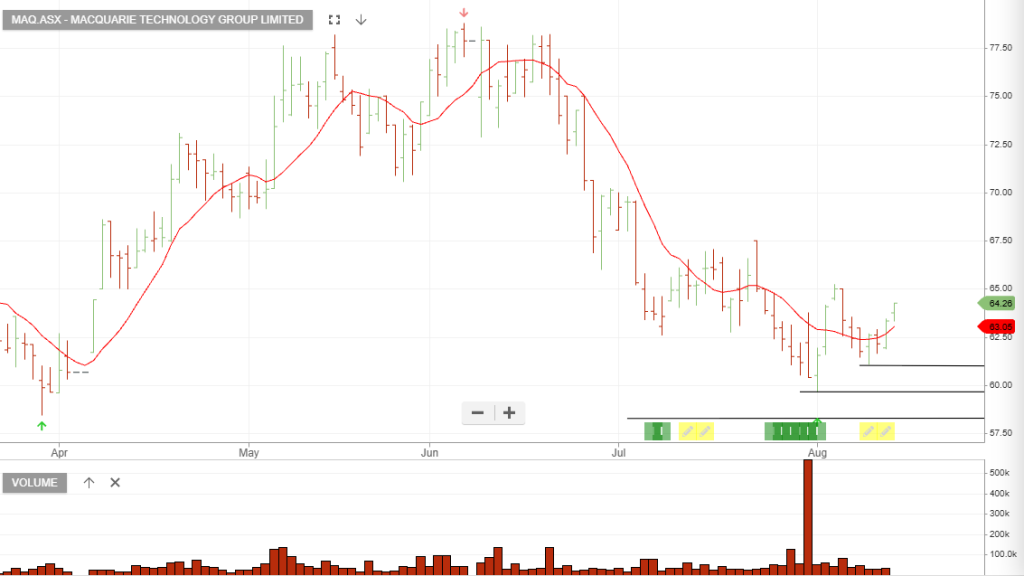
Update 13/8: Entry condition triggered, buy with a stop loss at $61.09
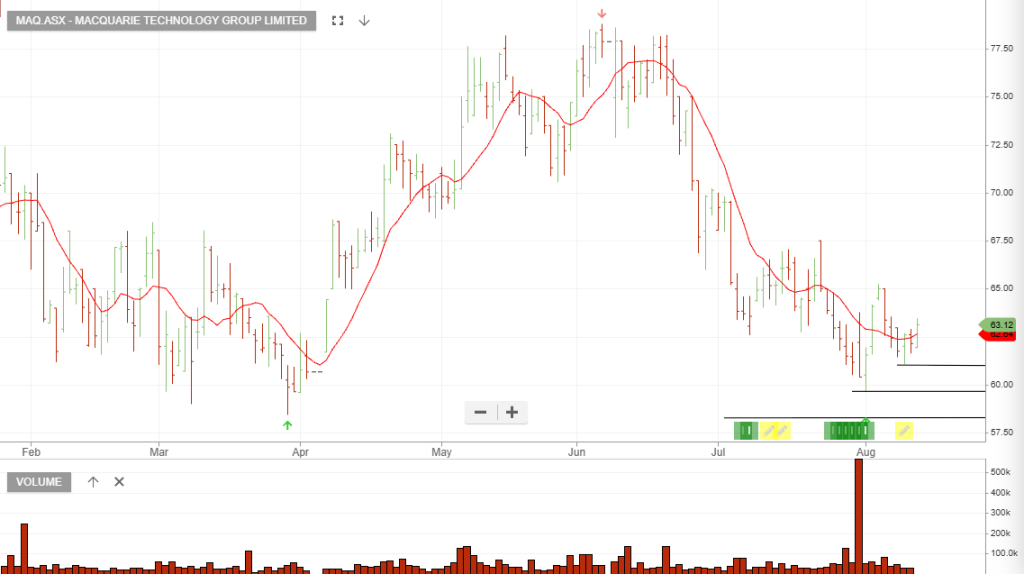
Full-Year FY26 Consensus Forecast: Analysts expect full-year FY26 revenue in the range of A$380M – A$390M, representing a year-over-year revenue growth of roughly 3% to 5% compared to FY25
Valuation & Comparative Context
- Trailing P/E (TTM): ~48.5x – 50.7x (based on recent reported 12-month net profit).
- Why the Forward P/E expand relative to Trailing: Net profit after tax (NPAT) is temporarily compressed in the near term due to significant growth capital expenditures—specifically heavy ongoing investments into data centre capacity (e.g., IC3 SuperWest) and increased depreciation/financing costs.
EV/EBITDA Multiple: Shares trade at a forward EV/EBITDA of approximately 17.5x – 18.0x, reflecting strong underlying EBITDA cash flow performance relative to net bottom-line profit.
Macquarie Tech
Update 13/8: Entry condition triggered, buy with a stop loss at $61.09
Full-Year FY26 Consensus Forecast: Analysts expect full-year FY26 revenue in the range of A$380M – A$390M, representing a year-over-year revenue growth of roughly 3% to 5% compared to FY25
Valuation & Comparative Context
- Trailing P/E (TTM): ~48.5x – 50.7x (based on recent reported 12-month net profit).
- Why the Forward P/E expand relative to Trailing: Net profit after tax (NPAT) is temporarily compressed in the near term due to significant growth capital expenditures—specifically heavy ongoing investments into data centre capacity (e.g., IC3 SuperWest) and increased depreciation/financing costs.
EV/EBITDA Multiple: Shares trade at a forward EV/EBITDA of approximately 17.5x – 18.0x, reflecting strong underlying EBITDA cash flow performance relative to net bottom-line profit.
Macquarie Tech
Full-Year FY26 Consensus Forecast: Analysts expect full-year FY26 revenue in the range of A$380M – A$390M, representing a year-over-year revenue growth of roughly 3% to 5% compared to FY25
Valuation & Comparative Context
- Trailing P/E (TTM): ~48.5x – 50.7x (based on recent reported 12-month net profit).
- Why the Forward P/E expand relative to Trailing: Net profit after tax (NPAT) is temporarily compressed in the near term due to significant growth capital expenditures—specifically heavy ongoing investments into data centre capacity (e.g., IC3 SuperWest) and increased depreciation/financing costs.
EV/EBITDA Multiple: Shares trade at a forward EV/EBITDA of approximately 17.5x – 18.0x, reflecting strong underlying EBITDA cash flow performance relative to net bottom-line profit.
Macquarie Tech
Macquarie Tech
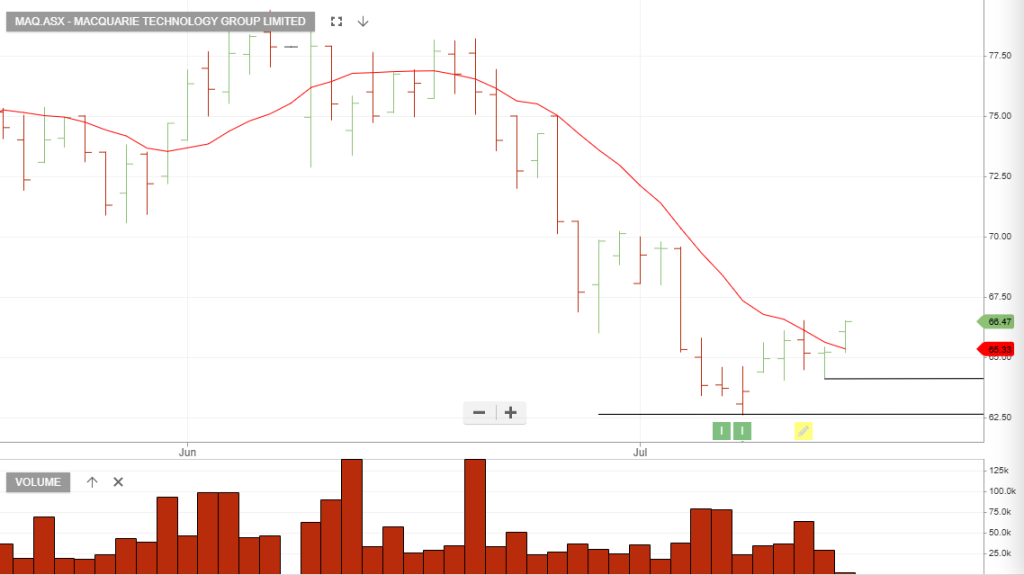
Macquarie Technology Group add to watchlist.
Macquarie Technology
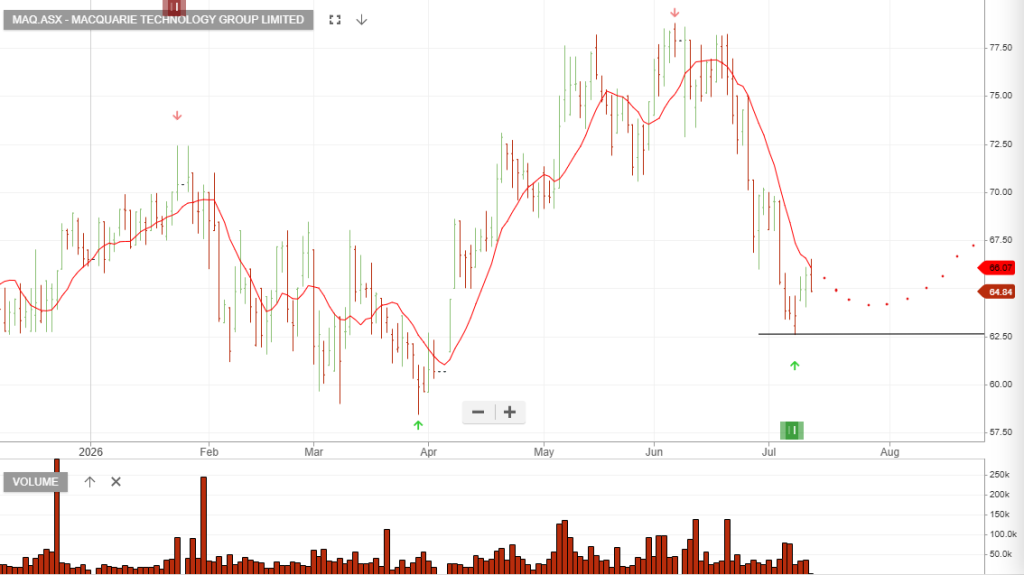
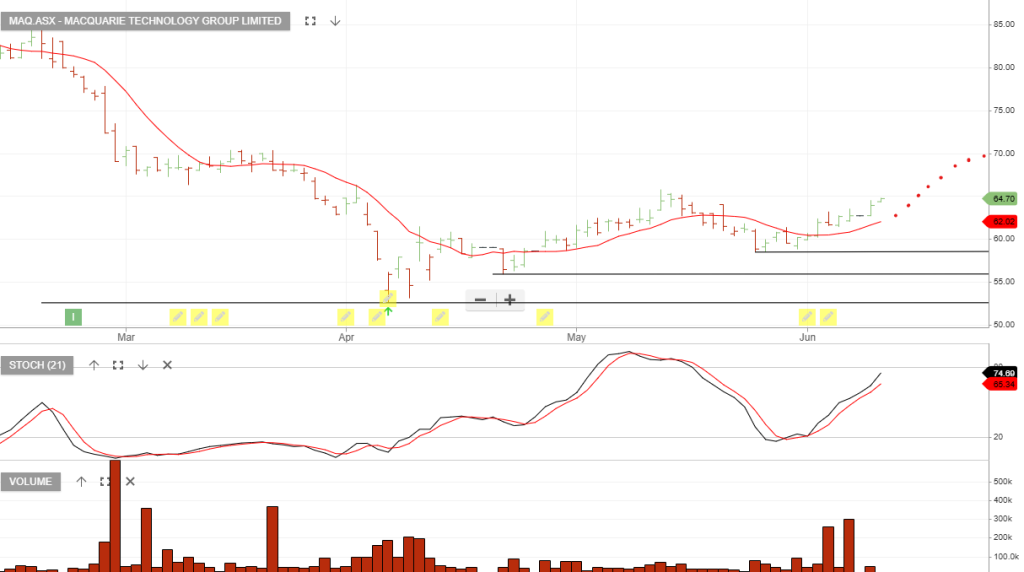
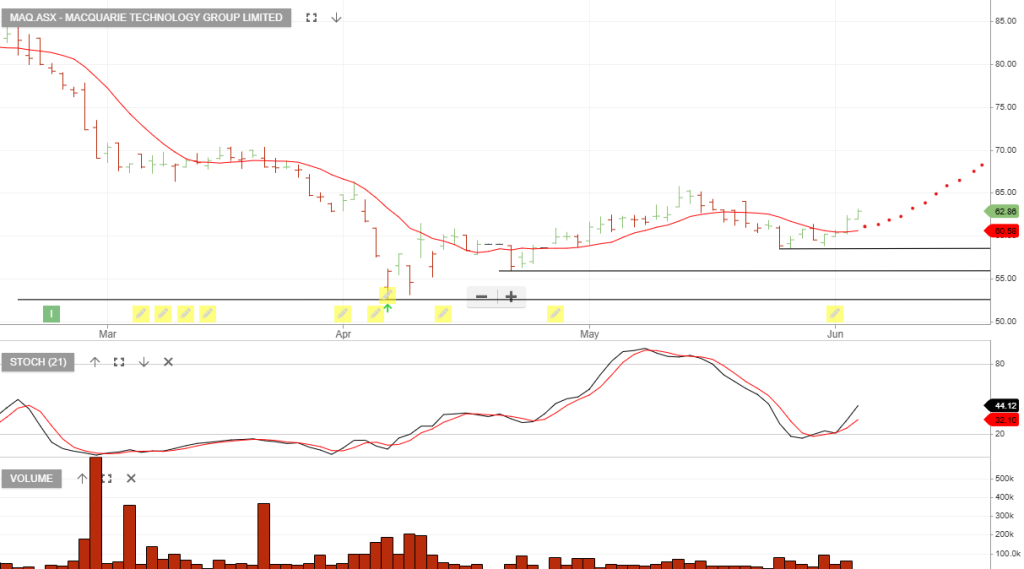
Macquarie Technology Group has found buying support above the $61.22 pivot low.
Buy with a stop loss at $61.22
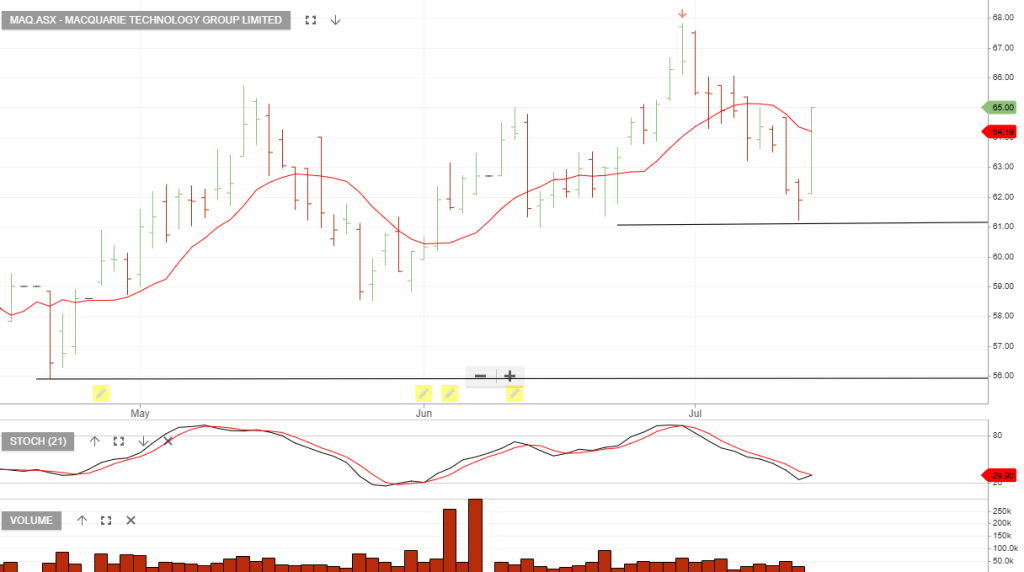
Macquarie Technology is rallying due to its recent acquisition of land for a new data centre campus in Sydney. This strategic expansion aims to enhance its capacity for hyperscale, AI, cloud, and government workloads, boosting its market position.
Macquarie Technology
Macquarie Technology Group : Buy with a stop loss at $58.52
Macquarie Technology

Level 17 Chifley Tower
2 Chifley Square
Sydney, NSW 2000
1300 614 002
Investor Signals Pty Ltd
ABN 44 143 555 453