Global Macro

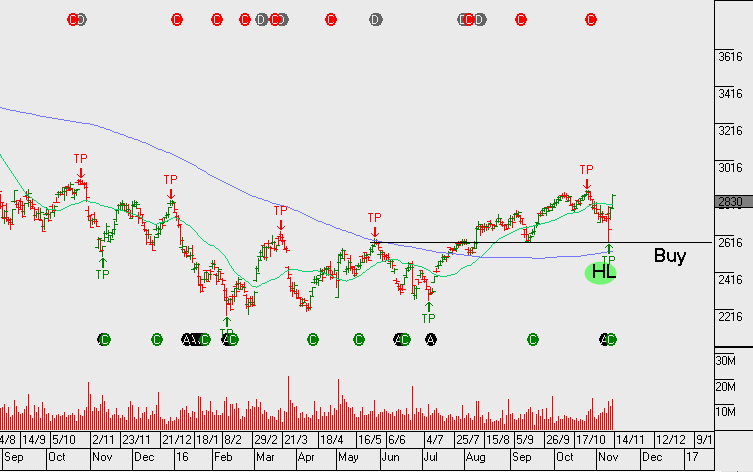
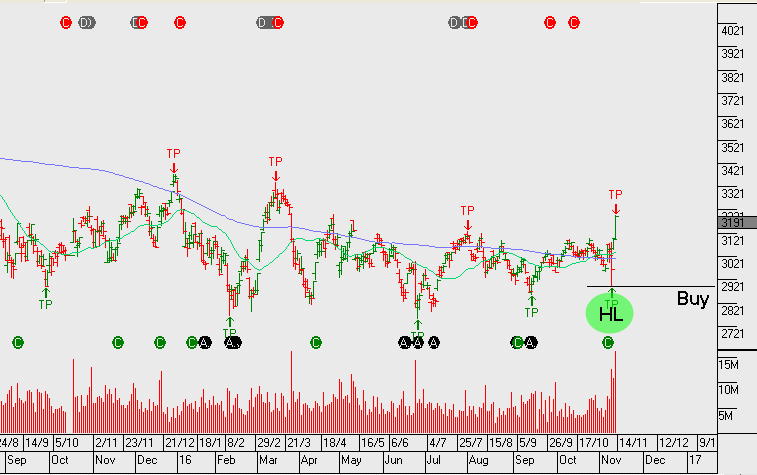
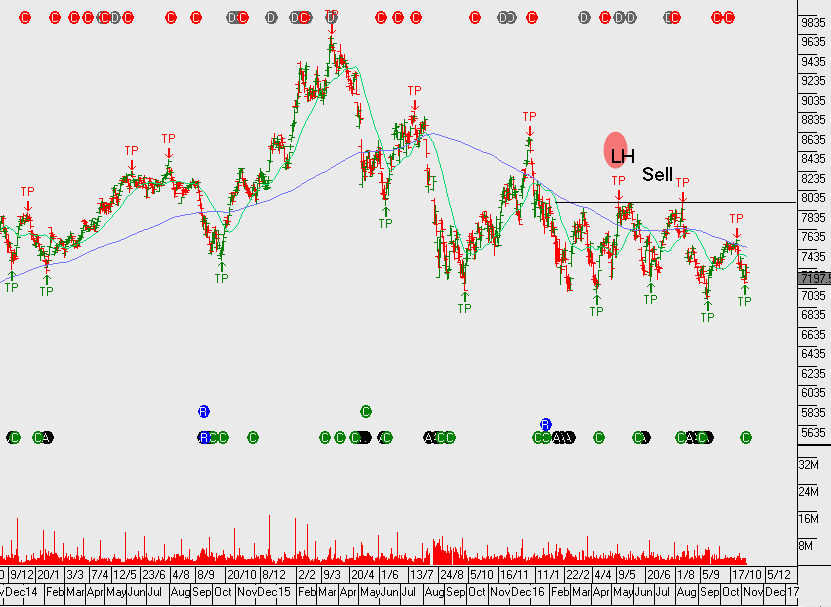
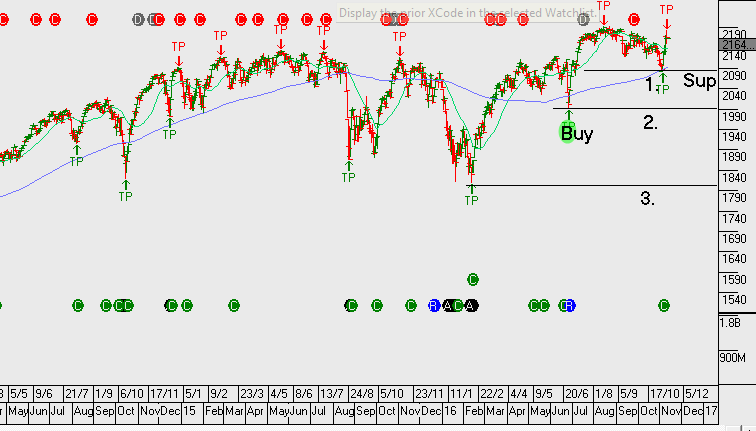
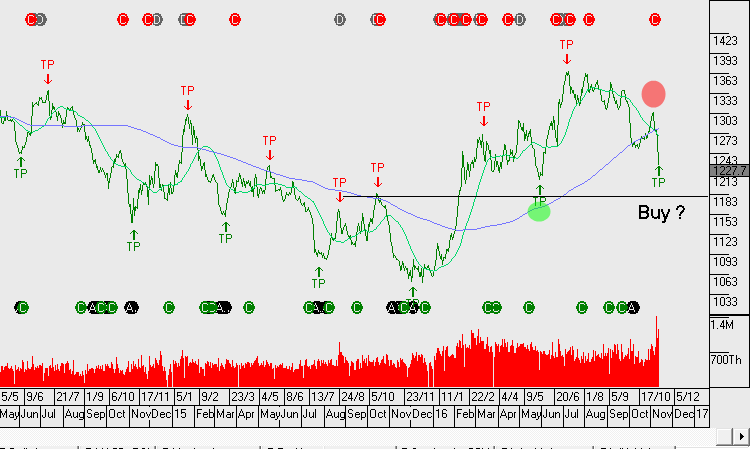
Following Mr Trump winning the election and Mrs Clinton accepting the result, bedlam broke out in the financial markets midway through the Asian timeframe: the USD was sold off across the board, Gold rallied $60.00 to $1,335.00, the SP 500 fell limit down to 2030, bond yields plunged 15 basis points and the Mexican Peso made a new all-time low at 20.75.

However, just as the London dealers were rolling up their sleeves, calculating potential margin calls and preparing for a financial blood bath, the market dynamic changed. The catalyst of the market stabilization and subsequent rally appears to be two-fold: 1) Mrs Clinton called Mr Trump to concede defeat (which meant no chance of a protracted legal challenge) and 2) the market started pricing in the reflationary aspects of some of Mr Trumps campaign promises.

The cornerstone of his general economic plan has been the initiation of a massive infrastructure package. However, the market was caught off-guard by the announcement that part of the package would be funded by a tax concession to US corporations holding US Dollars off shore.

It’s estimated that up to $2.9 Trillion of corporate profits are being held off-shore by US companies unwilling to take the 35% profit tax charge to repatriate the money. These  multi-national companies include General Electric, Apple, Microsoft and Intel……all of which have more than $100 billion parked overseas.

As the news of this proposed tax reform/amnesty plan circulated through the market, infrastructure names, heavy construction companies and stocks of military defence contractors all rallied higher. Whether or not this grand plan ever makes its way into the US economy will be determined on another day.

But as the US market heads into the three-day Veteran’s Day holiday, the USD Index is back over 98.50, US 10-yr yields are over 2.15% and the SP 500 is poised for its strongest weekly gain in over two years.

Next week the market will focus on data from the EU and Japan, but for now, global risk assets are satisfied that the transition of Presidential power will transfer smoothly and that Mr Trump is going focus on the economy first.
sp500
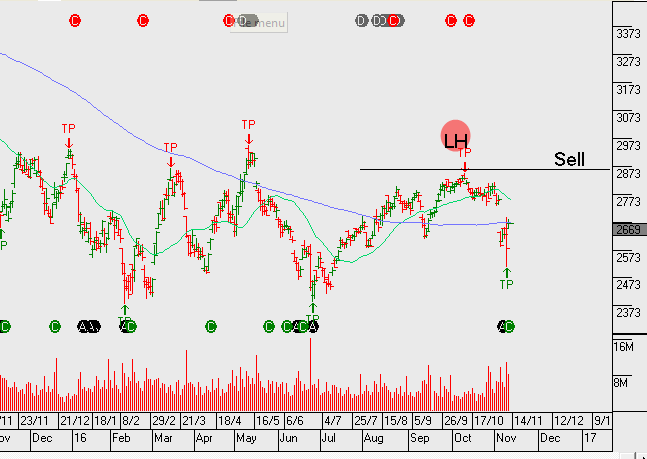
Chart – S&P500
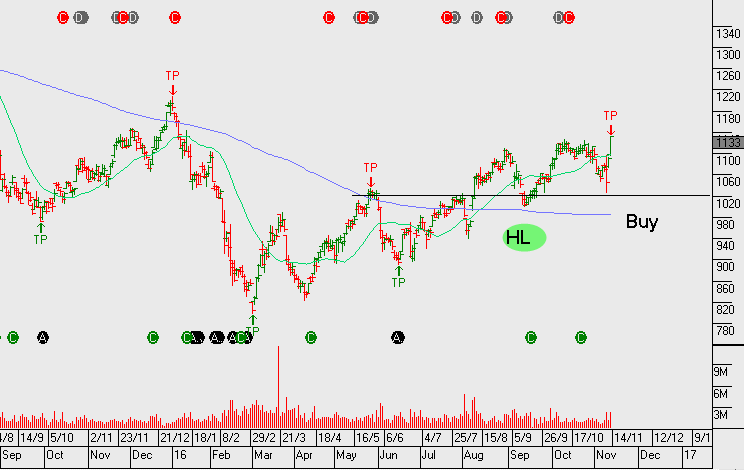
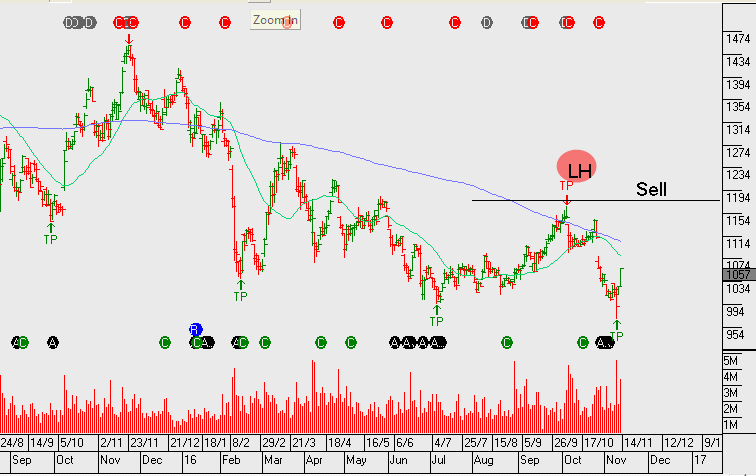
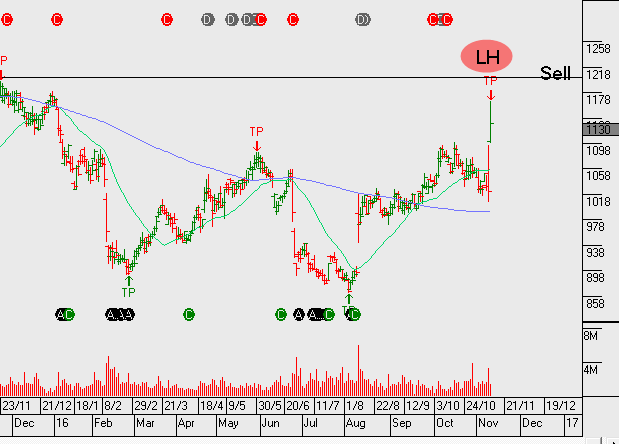
Chart - Gold
Chart – Gold


Australian Bank Trends – WBC & ANZ Breakout

We now have ANZ and WBC creating a higher low formation. However, CBA and NAB still remain below the recent highs within the downtrend that’s been in place since May 2015.

Back in August, ANZ was the first to break the downtrend and now WBC has followed. Within the regional banks, between BOQ and BEN, it’s Bendigo that’s displaying a more bullish price pattern.

Although the breakout in financials is strong at present, we don’t see too much further upside. As reflected in the recent earnings results, the banks are having difficulties growing top line revenue. Our largest bank exposure in client portfolios is Westpac. We’ve left this name uncovered at present, however, it’s likely we’ll identify a point this week to add covered calls to enhance the yield.

ANZ goes ex-dividend $0.80 on Monday & WBC also goes ex-dividend $1.00 on Monday.

anz
Chart – ANZ
wbc
Chart – WBC
cba
Chart – CBA
nab
Chart NAB
Chart - BEN
Chart – BEN
boq
Chart BOQ

National Australia Bank – 2H16 Earnings

National Australia Bank delivered 2H16 earnings which showed strong organic capital generation and underlying earnings trends that were relatively strong compared to their banking peers. In addition, it’s also worth noting that the SME business segment is showing early signs of a pickup in credit growth; this is an area where NAB has traditionally led its competitors.

NAB trades on almost a 10% discount to its peers and we may begin to see scope for this discount gap to close.

Consistent across all the major banks, we continue to see mortgage margins under pressure. This remains a concern, especially for Westpac and CBA as they’re likely be impacted the greatest by declining mortgage margins.

NAB FY17 underlying profit is expected to be $10b on EPS of $2.30 and DPS of $1.70 placing the stock on a forward yield of 6.5%.

Financials globally are getting a boost following the US election, however, we remain cautious and look to sell call options into the rally.

nab
Chart – NAB

Higher Low Pattern Stocks to Add to Your Watchlist

The following group of stocks are in either established uptrends or, in recent months they’ve broken downtrends to begin building the early stages of a bullish “higher low” formation.

Many of these names have been mentioned previously in the blog and/or the monthly strategy video report. It’s worth loading these codes into your watch list and considering rebalancing your portfolio to include allocations towards some, or all of these names:

JHX, LLC, MQG, SHL, TWE, ANN, ANZ, ASX, CCL, CIM, COH, QUB, TAH, WOW & WPL.

With the lower growth names within the above basket, such as WOW & CCL, we compliment the position now with tight covered calls to enhance the yield to 10%+ per annum. With some of the other names, we give a little more breathing space as we expect 5 to 10% price appreciation before selling the call option overlay.


Yield Names Remain Under Pressure

Yield sensitive names remain under pressure as the bond sell-off in the US continues. As bond prices trade lower, the yield is increasing. Higher yields, make interest rate sensitive names like infrastructure and property trusts less appealing.

The sell-off in domestic names such as APA, GMG, GPT, SGP, TLS, TCL, SYD, WFD & SCG has been significant. With many of these names now trading on yields within 4.5 to 6.5% range.

There’s a case to be made for the above stocks to find support as the outlook for interest rates begin to stabilise.

10yr
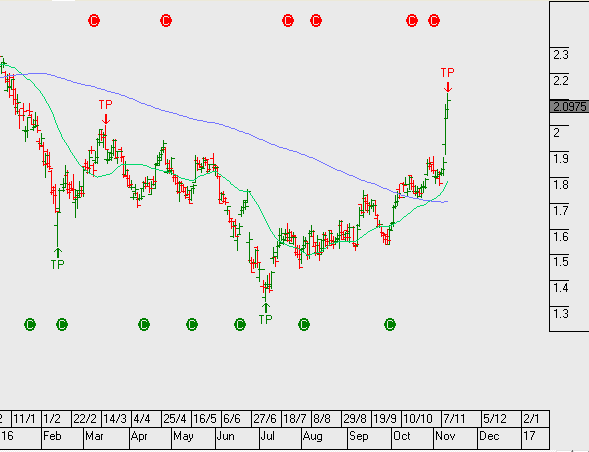
Chart – US10yr bond yield

Medibank Private – Call Option Enhances Yield

Medibank is struggling with top line growth of 1.5%, meanwhile underlying cost growth is running at an average of 5%.

We were recent buyers of MPL at $2.35 and with the stock hitting our $2.60 price target, we sold calls to enhance to yield.

MPL is likely to trades sideways and investors should use covered calls to enhance the yield. Excluding the added income from call options, MPL trades on an FY17 forward yield of 4.7%, assuming profit of $420m, EPS of $0.15 and DPS of $0.12.

Through adding a covered call we are delivering in excess of 10% cash flow (plus franking credit) and allowing for moderate capital growth.

Chart - Medibank Private
Chart – Medibank Private


S&P500 Bounces & Holds Higher Low Support

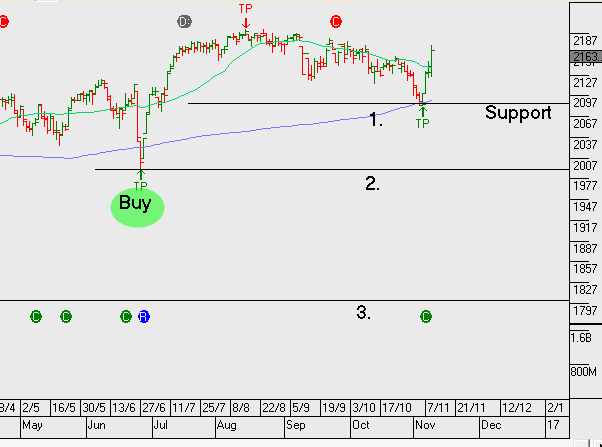
We’ve remained bullish equities and our base case has been that US stocks would hold support following a satisfactory 3Q earnings result. Our resolve was tested in the last 24 hours with US markets down sharply as the election result and Trump Presidency looked possible. However, by the time the Presidential acceptance speech began, the market losses on US indices were cut in half and by the close of US trading markets were up on average by 2%.

We keep our long bias towards equities and turn our focus back to the reality that 3Q S&P500 average earnings per shares growth is tracking at  only 3.5% up on the same time last year. Considering the magnitude of share buybacks, we don’t consider the underlying earnings growth to be that encouraging. Chinese export data remains weak, reflecting the slow growth in the global economy and bond yields continue to push higher in the US with the 10year bonds now trading up from 1.3 to 2.05% over the last 3 months.

As stated in the monthly strategy review video, we caution portfolio investors on a blanket buy and hold strategy. We encourage you to establish contact with us, so we can discuss the advantage of adding a call option strategy to your holdings, as well implementing well timed trading ideas around the fringe of your portfolio to help deliver better outright returns.

Chart _ S&P500
Chart _ S&P500


Computershare FY17 Earnings Guidance

At yesterday’s AGM, Computershare gave guidance for FY17 which  suggests the group has found an inflection point in their earnings. After almost 2 years of earnings downgrades and underperformance, management is increasingly looking towards mortgage servicing for growth, as the mature share registry business faces structural pressure.

CPU guided towards FY17 EPS to be marginally up on FY16. Contribution from Mortgage Servicing is required to deliver the growth.

Forecast FY17 revenue $2b on EBIT of $500m, EPS of $0.57 and DPS of $0.27 placing the stock on a forward yield of 3.3%.

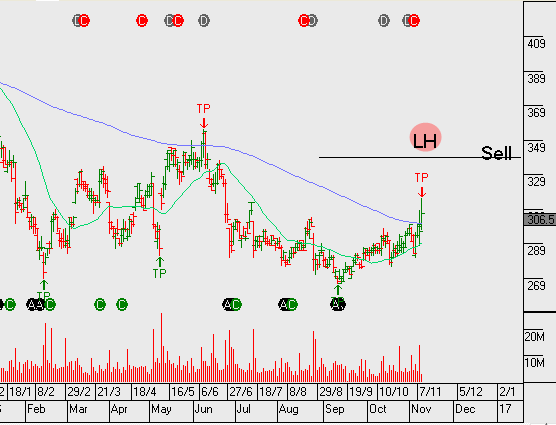
We continue to remain cautious and question the certainty of a sustained turnaround in earnings. We continue to watch this name from the short side. The algorithm engine will be tracking CPU for a short signal as the market bounces back after the post Trump victory rally.

cpu

Chart – Computershare


Incitec Pivot Reports FY16 Earnings

Incitec Pivot reported FY16 NPAT of $295m.

Moranbah production remains strong with output hitting a new record. The Louisiana plant will come in below budget. Any new capital management will be contingent on better fertiliser prices and reliable  output from the new Louisiana plant.

With gearing likely to begin falling over the next 12 months we may see capital management in Fy18 or FY19.

FY17 we see revenue increasing to $3.8b, EBIT increasing 10% to $490m, EPS of $0.18 and DPS of $0.11, placing the stock on a forward yield of 3.5%

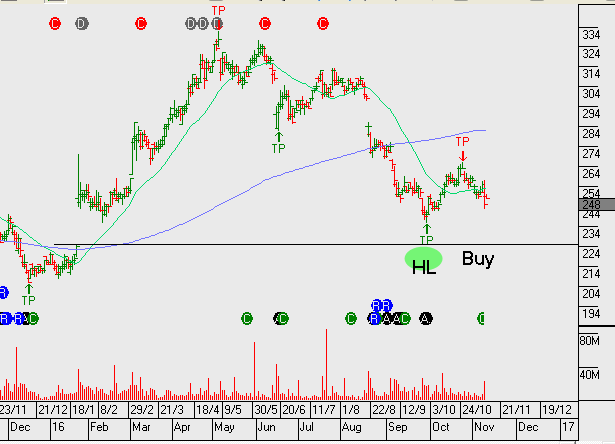
IPL has struggled with difficult industry conditions over the past 18 months, the tide may be turning but we will wait for a higher low formation from the algorithm engine before setting up new buying levels.

ipl
Chart – Incitec Pivot


CBA Reports 1Q17 Earnings

CBA reported 1Q17 earnings of $2.4 billion, which was largely in line with market expectations. On pre-provision basis the result was marginally below consensus.

CBA’s result was supported by an improvement trading income and lower impairment expense. Revenue growth trends continued to slow with growth falling from 5% in FY16 to 3% in FY17.

FY17 outlook is for EPS of $5.40 and DPS of $4.20 placing the stock on a forward yield of 5.8%

CBA remains in a structural downtrend and like all bank holdings should be complemented with covered call options to enhance the risk reward scenario. Additionally, investors need to be cautious about being overweight banks as other more attractive opportunities exist within the group of ASX top 50 stocks. These companies also offer high yield plus franking credits supported by solid EPS growth.

cba
Chat – CBA