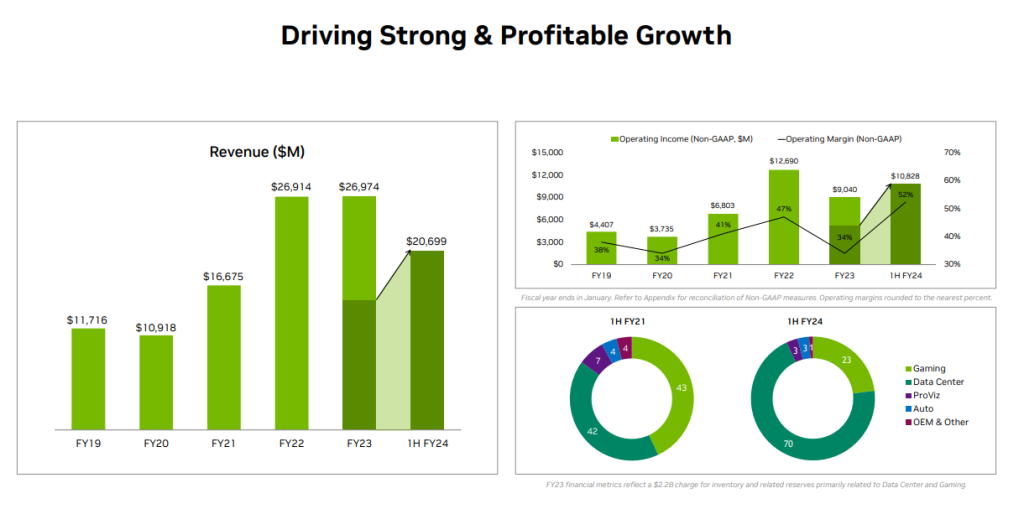
Nvidia: Q3 Earnings Review
Third-quarter revenue increased 34% from the prior quarter and 206% from a year ago, reflecting how increased demand for AI has boosted the company’s sales throughout 2023.
The company’s revenue guidance for the current quarter also topped estimates, coming in at $20 billion.


Watch Last Night’s Webinar
In case you missed it, you can watch last night’s webinar here.
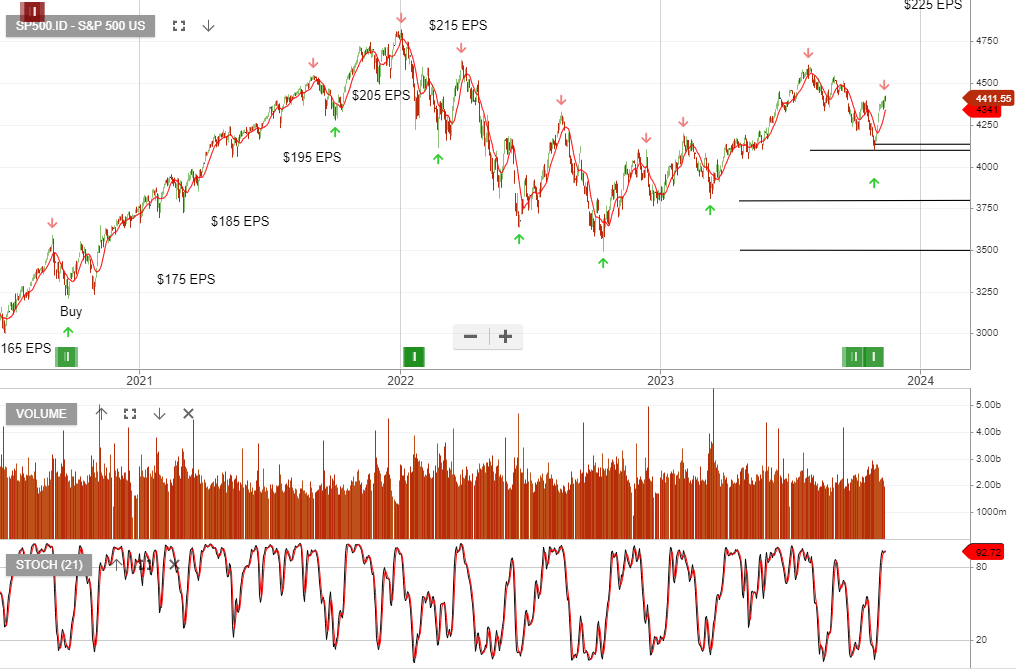
S&P500: Q3 Earnings
S&P 500 Q3 earnings increased for the first time since last year, with average EPS up 4% year over year. If energy is excluded, the result is more impressive at +10% growth.
S&P 500 EPS forecasts for the full year are $225, (largely the same as 2022), and in 2024 EPS growth is forecast to increase 5% to $237.
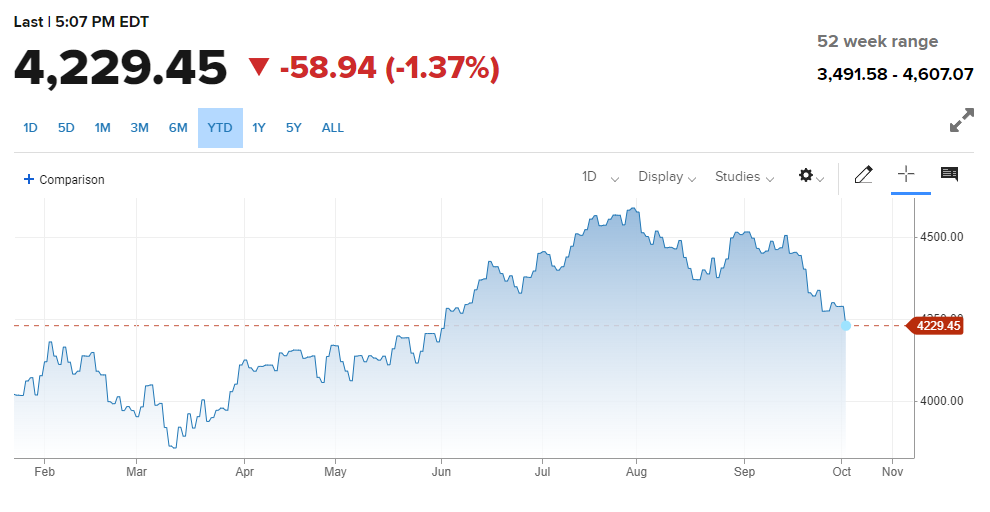
At 4500 points the S&P500 is trading at 20x forward EPS.
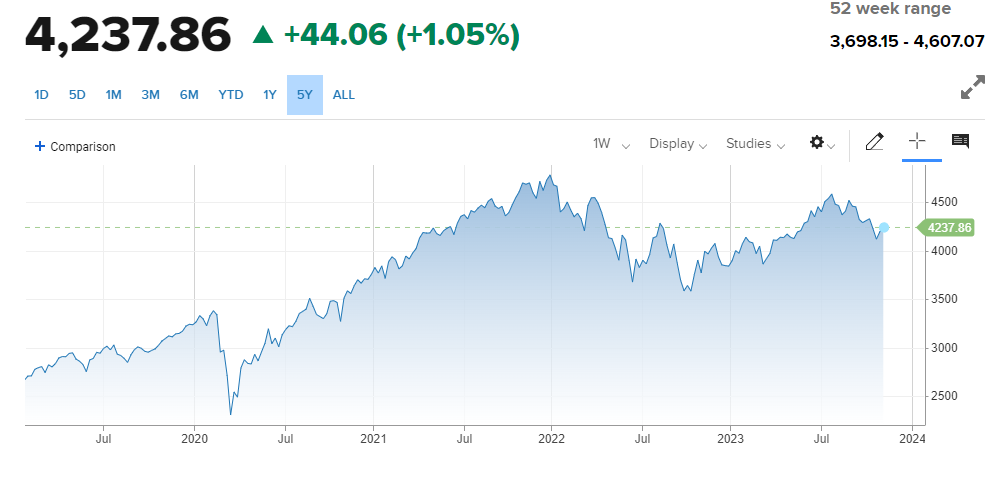
S&P500: 5 year graph
US ISM manufacturing index logged its twelfth straight month in contractionary territory for October, suggesting slowing economic activity. However, labour market conditions remain tight.
Watch Last Night’s Webinar
In case you missed it, you can watch last night’s webinar here.
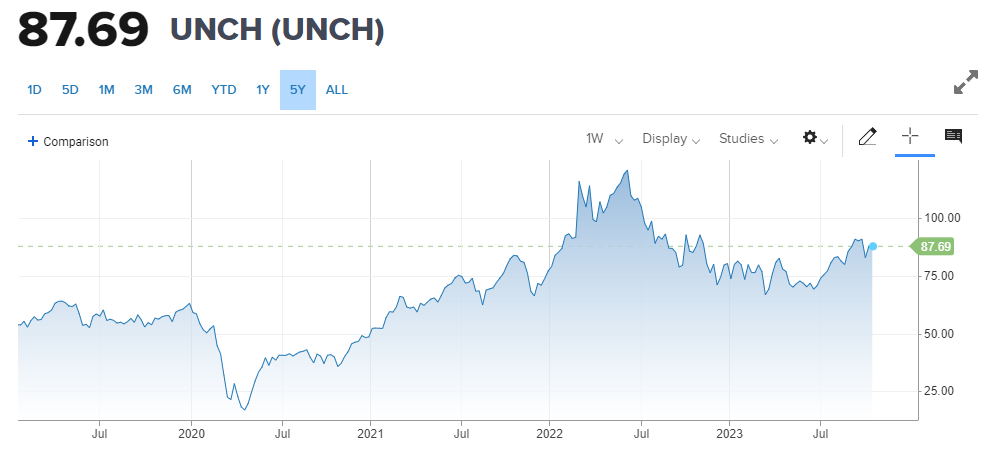
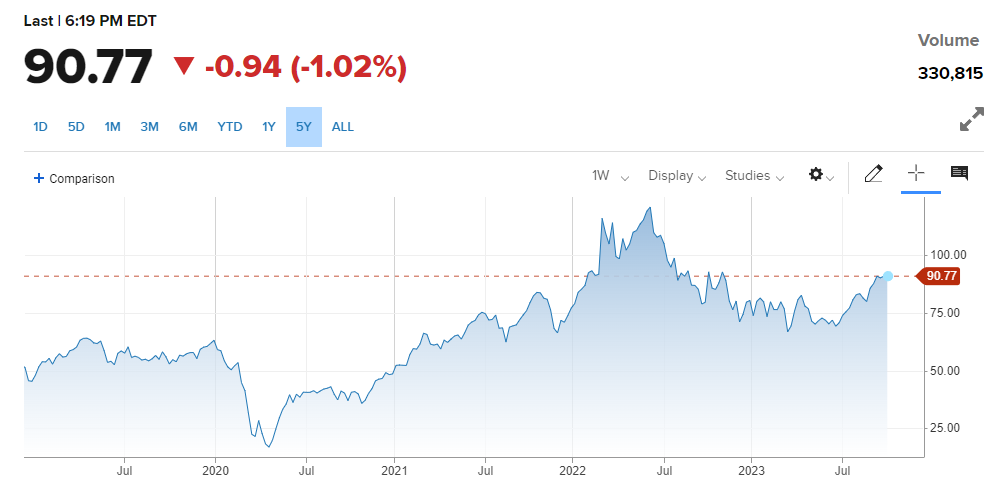
Oil
5-year graph of oil.
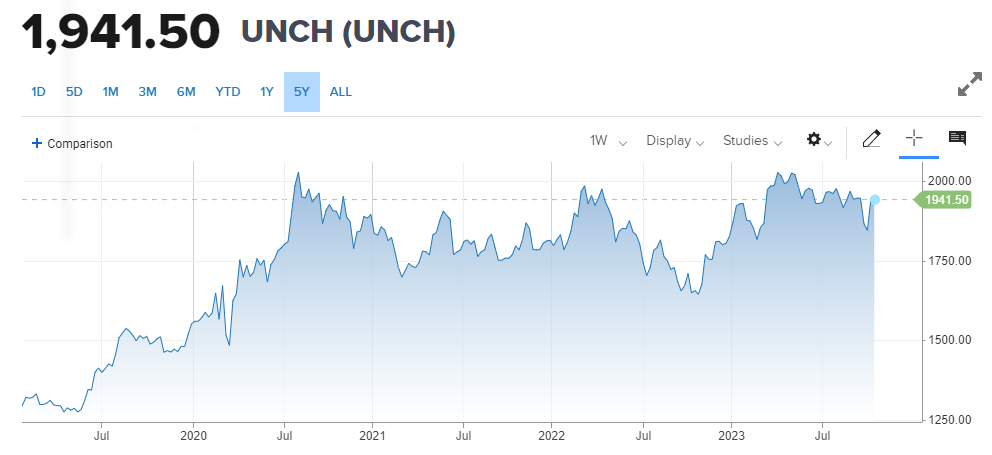
Gold
5-year graph of gold.
S&P500
The S&P500 was down 4.87% in September, bringing its YTD return to 11.68%. The Dow continued to significantly trail the S&P 500 YTD, up 1.09%.
WTI Crude: 5-Year Graph
Level 17 Chifley Tower
2 Chifley Square
Sydney, NSW 2000
1300 614 002
Investor Signals Pty Ltd
ABN 44 143 555 453