Algo Sell Signal For Transurban

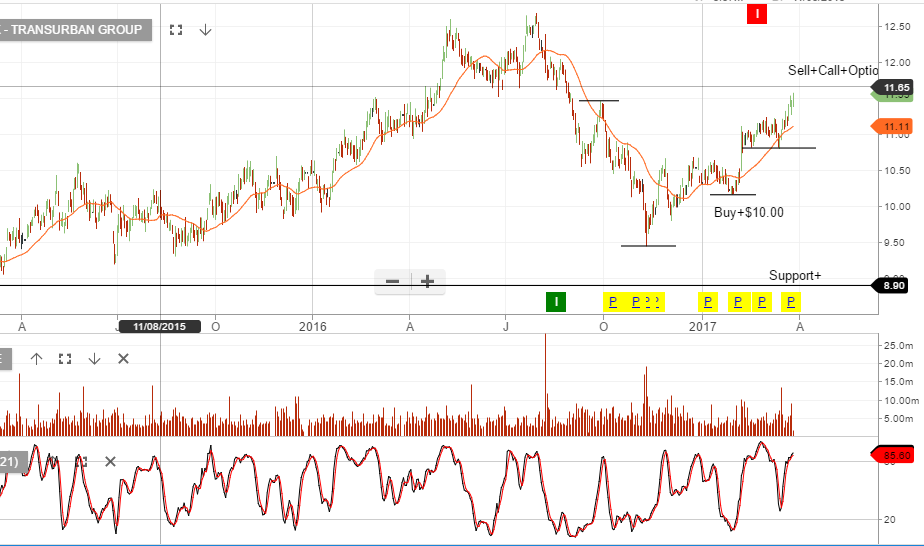
The Algo Engine triggered a sell signal in Transurban (TCL) yesterday at $11.72.

The stock has rallied over $1.00 since last week’s announcement that tolls to pay for an upgrade of the Inner City By-Pass in Brisbane.

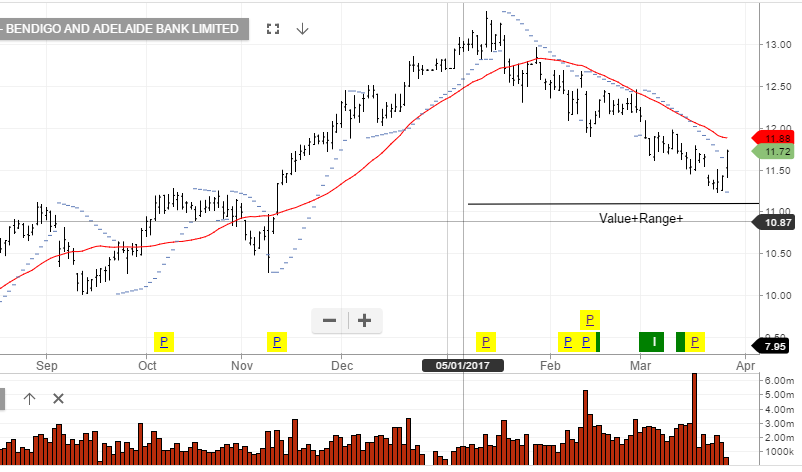
From a broader perspective, TCL has traded between the $12.65 high made in August, and the low of of $9.45 posted in early November.

The $11.72 level is a bit higher than the 50% retracment of of this range, but we see stiff chart resistance at $12.00. We see the first level of support in the $10.80 area.

We own TCL in client portfolios from lower levels and we’ve been bullish in recent weeks on TCL and utilities, in general. This view has been predicated on the faltering backdrop for the the global relation trade.

The rally in TCL will soon stall at near $12.00 and investors should sell call options into September, with a view towards maintaining exposure to the upcoming $0.25 dividend in June.

Chart-Transurban

Dow Jones – Key Chart Signals

The Dow Jones has found short-term support in the higher low structure at 20,412. A break below this in the next day or two will be negative for US equities.

For the time being, we’re seeing buy signals from the Algo Engine in some of the beaten-down key US financials, Goldman Sachs, JP Morgan, Morgan Stanley & and Bank of America.

Chart – Dow Jones
Chart – Goldman Sachs
Chart – JP Morgan
Chart – Morgan Stanley
Chart – Bank of America


BHP & RIO – Where is Support

Our Algo Engine has triggered multiple buy signals across the major resource names, both in metals and in energy.

With the peak to trough sell-off among the sector extending between 13% – 20% it’s likely we find some value investors stepping back in to the market.

We’re comfortable with select exposure in BHP, RIO, S32, WPL, OSH, ORG but caution investors that stop-losses below the recent lows will be a prudent way of managing risks.

It seems unlikely that any buying interest from this level will carry the above names to new near-term highs. We’re of the view that a corrective bounce will top out at 5 – 7% above recent lows

We see the recent volatility in oil and iron ore, being primarily driven by US Dollar swings rather than related to any fundamental factors and remain cautious of negative news flow from China’s unsustainable debt problem within their shadow banking industry.

Chart – BHP
Chart – RIO


Qantas – breaking out

QAN has enjoyed strong share price performance since the release of its
1H17 results on 23 Feb 17. This has been partly supported by by the share buy-back program which at the current rates will end in the next week or two.

FY18 revenue is forecast to be $16b, EBIT flat at 1.6b, EPS $0.56 and DPS $0.26, placing the stock on a forward yield of 6%.

We’ll watch for the next Algo Engine buy signal on the structural higher low formation.

Chart – QAN


CSL and Cochlear – Valuation & Earnings Update

CSL trades 27x forward earnings.

FY18 revenue to grow 5% to US$7b, EBIT +18% to US$2.2b, EPS US$3.60 & DPS US$1.70.

This places CSL on a forward yield of 1.8% into FY18.

We own CSL and recommend a covered call into the $130 range to enhance the yield.

Chart-CSL


Cochlear was recently triggered by the Algo Engine as a buy signal and we update our 12-month share price target  to $138 based on a PE of ~27.5x. and a forward yield of 2%.

Risks remain associated with COH reimbursement changes, regulatory
intervention and adverse currency movements. However, momentum favors the stock at present.

Chart-COH


US 10-year Yields

The Dow Jones 30 posted it’s 7th straight lower close for the first time since 1978.

As a result, the US 10-year bond yields fell to a 1-month low of 2.38%. An increase in equity market volatility could could lead to another 10 to 15 basis points of downside on the yield.

Some of the local names that have moved higher on the lower yields have been SYD, TCL, WFD  and, to a lesser degree, TLS.

It’s likely interest rate stabilization will work as a near-term cap on these companies and allow for a covered call strategy to enhance the portfolio returns

Bendigo Bank: Reverting Higher

On March 16th, the ALGO engine flagged a buy sign for Bendigo Bank (BEN) at, or near, the $11.00 level.

BEN shares have reached $11.68 in early trade today.

Looking from a broader perspective, we believe the chart reflects a mean-reversion pattern, as opposed to the beginning a protracted trend higher.

On January 12th, BEN posted a high of $13.40 before reversing lower. On March 24th, BEN traded as low as $11.20 and then began to move higher.

Taking into account the high valuation of the domestic banking sector, we would expect the upside in the current move to be capped at or near  $12.30, which is the 50% reversion level of the move from $13.40 to $11.20.

Prudent money management on this trade would be to work a sell stop at last week’s low of $11.20.

Chart-Bendigo

CBA- Back to the $80.00 Handle?

Shares of Commonwealth Bank (CBA) have been trading below the 30-day moving average of $83.80 for the last four consecutive trading sessions.

As the technical picture continues to deteriorate, we have looked at some previous chart resistance levels which could now act as price support.

Between late January and early February, CBA tested the $81.10 level three times over the course of 10 trading sessions; this will be the first key support level.

However, going back to May of last year, CBA shares failed to break above $80.00 five times before extending higher in July. We feel that this is a more significant support level and a reasonable medium-term target.

Investors and subscribers will remember that we sold European-style call options on CBA in late January. By selling the $83.01 strike-price into March, we were able to collect $2.50 in option premium and still hold the shares to collect the $2.00 dividend paid in February.

Those options will expire this Thursday.

As such, we will look to reset the derivative overlay strategy in CBA on corrective price moves higher.

Chart-CBA