Gold/Newcrest Break Higher

As Wall Street stocks moved lower, gold prices continued to attract “safe haven” flows.

As mentioned in our earlier post, the yellow metal met technical resistance at the 30-day moving average price of $1230.00 last Friday.

However, with global equities correcting from recent highs, the next key resistance level will be the February 27th high of $1263.00.

Similarly, shares of Newcrest Mining have broken above the 30-day moving average and now look set to test the February 23rd high at $23.45
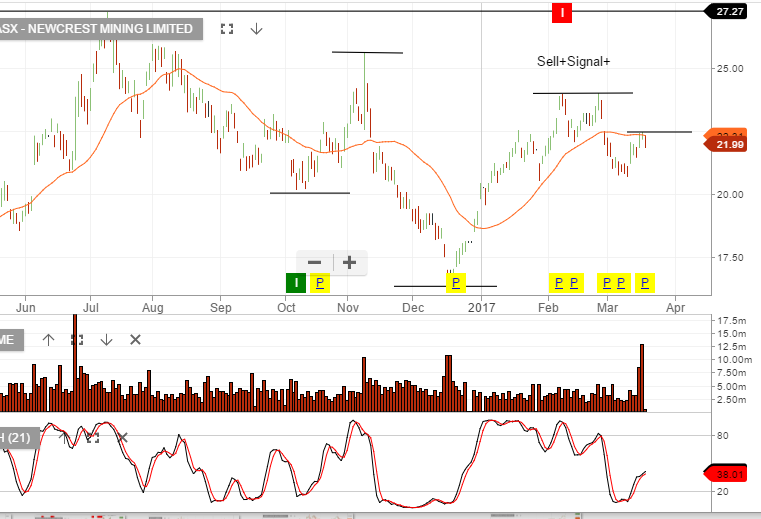
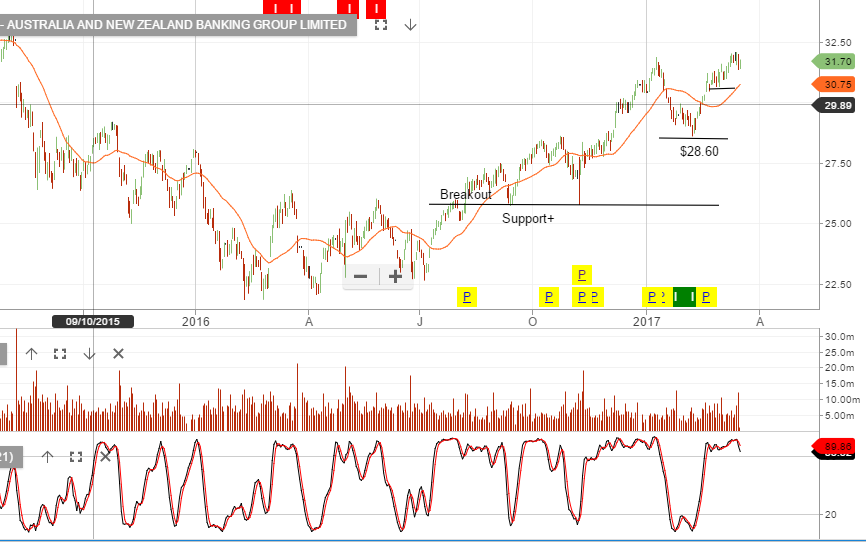
Algo Signal – SYD & TCL

The Algo Engine flagged SYD as a short signal yesterday. At this stage, we’re thinking SYD trades sideways, (rather than lower), and consolidates heading into the June dividend.

With the stock at or near $6.50, it places SYD on a 5% yield and when complimented with a tight covered call, we’re able to generate 12% annualized cash flow. If price breakdowns below $6.25, we’ll reassess the strategy.

Utilities & REIT’s, (SYD & TCL), are benefiting from US yields retreating from recent highs.

Chart – SYD
Chart – TCL


GOLD/Newcrest Approach Resistance Levels

Both the share price of Newcrest Mining and Spot Gold rallied sharply last week.

As such, both are now trading against the key technical resistance at the 30-day moving average areas of $22.00 and $1230.00, respectfully.

Looking ahead, the question is whether the inverse correlation between global equity prices and Gold continues, and whether that will continue to lift the shares of Newcrest?

On Friday, the daily trading volume in Newcrest was 12.7 million shares.

This is more than twice the average daily turnover of 5.5 million and the largest volume day since 18.5 million shares were traded on June 24th, 2016.

Generally, an up-day in the share price, on expanding volume, is a positive sign for further gains in the share price.

At this point, we don’t have a buy signal from the ALGO engine but will watch the price action closely.

Chart – NCM

US Markets – Chart Update

US Stock Indexes closed lower on Friday as option expiration and continued weakness in the financial sector offset gains in the industrial and utility names.

The Financial index finished the day over 1.5% lower with the major banks stocks: JP Morgan, Goldman Sachs, Citi Group and Bank of America all falling by more than 1% by the New York close.

With the SP 500 index now trading at 22 X earnings on a forward yield of just under 2.5%, the medium-term fundamentals don’t appear to support the high level consolidation at these prices.

Technically, the SP 500 index has not closed below the 30-day moving average in over 4 months.

We now see key price support at 2356.00. A break of this level would likely extend back to the February 13th low of 2310.00.

Chart below of Dow Jones Index and S&P500


Chart – IVV (S&P500 ETF)
Chart – Dow Jones


TABCORP Fined $45 Million

Tabcorp has agreed to pay the largest civil penalty in Australian corporate history yesterday, as company officials admitted that they had failed in it’s obligation to strictly follow domestic Anti-money laundering laws.

The gaming company agreed to pay $45 million to the Federal Government and pledged to modify its protocol for management oversight and operational execution of their money laundering program.

We feel the “silver lining” to this story is that the ACCC will take a favorable view of Tabcorp’s admission of oversight and commitment to increasing internal surveillance when ruling on the pending merger with Tatts group.

Shares of the company have traded back to support at $4.50 in early trade. We view Tabcorp as a $5.00 stock in the medium-term and suggest adding to long positions at these levels.

Amcor – Finding Support

Amcor looks like it is finding support at $14.25 and could trade up to $15.00.

With the stock on a  4% forward yield and earnings likely to grow at 4 – 8% p/a we think this makes a AMC a good buy-write strategy.

The August dividend plus the call option income is generating over 10% annualised cash flow, whilst still allowing 5% capital growth over the next 6 months.

Chart – AMC

Bendigo Bank – Algo Buy Signal

Our Algo Engine is flagging BEN with a technical buy signal.

We’re mindful of the downward pressure on the banking sector following today’s weak employment data.

Therefore, we’re not buyers at present, but we’ll be watching BEN and looking for the short term indicators to turn positive at or near the $11.00 support level.

Chart – BEN