On September 7th, the SP 500 posted an all-time high close at 2184.00. At the same time, the US 10-year notes were yielding 1.53%, the US 30-years were yielding 2.23% and the 2-year notes were yielding .75%. Over the last five trading sessions, the SP 500 has dropped as low as 2118.00, or just over 3% from the 2184.00 high. Over the same period, the 10-yr yields have climbed to 1.68%, the 30-years to 2.46% (both 10% higher) while the 2-yr note yields have remained unchanged at .75%.
When the US yield curve enters a phase in which longer dated bond yields rise, while the shorter dated yields remain unchanged, it’s called a “steepening yield curve.” Many market commentators consider a steepening yield curve a fundamental negative for stocks since higher yields on longer dated paper suggest the US Federal Reserve will further normalize the Fed Funds rate; which will push Treasury yields even higher. Along this line of thinking, current Dow theorists believe that the market could reach a “yield inflection point” whereby stock investors will sell shares and switch to the guaranteed returns offered with Treasury securities.
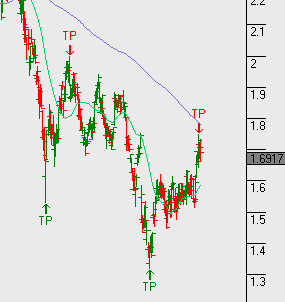
US 10 Year Bond Yields
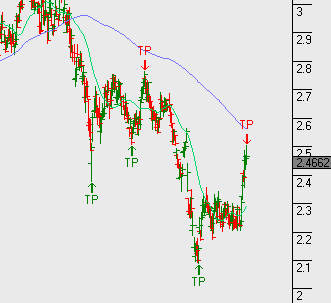
US 30 Year Bond Yields
S&P500 Index
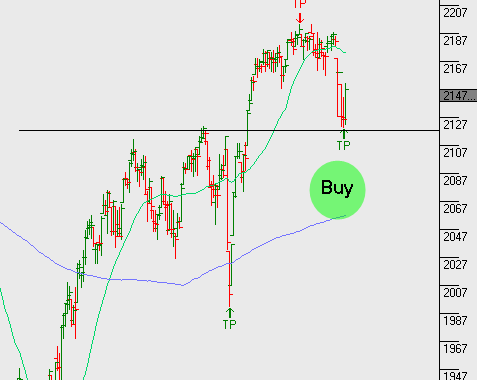
It’s worth noting last night’s reversal in the S&P500, from the support level indicated by the horizontal black line. This reversal may signal the rise in bond yields will soon exhaust. As a result, equity markets may then resume their rally higher. However, during times of economic expansion, both equities and bond yields can move higher in tandem. That’s just not been the case in recent times!