fbpx

Chart Update – XJO

The S&P/ASX 200 Index finished the week down 0.06%.

The best performer was the Energy sector, up 3.8%, and the worst performer was the Property Trusts sector, down 2.4%.

You're not a member!  Trial today

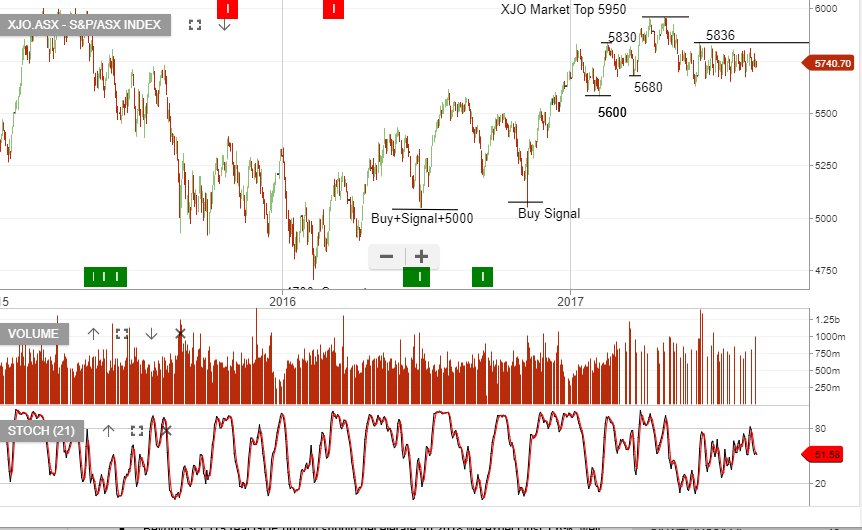
The XJO remains in a “lower high” pattern, following the sell-off from the recent  5836 level.

Chart – XJO


Leave a Reply

Investor Signals Pty Ltd ABN 44 143 555 453 is a Corporate Authorised Representative CAR No. 439411 of Advisor Plus Pty Ltd AFSL 474520
© 2024 Investor Signals

Send our ASX Research to your Inbox

Or start a free thirty day trial for our full service, which includes our ASX Research.