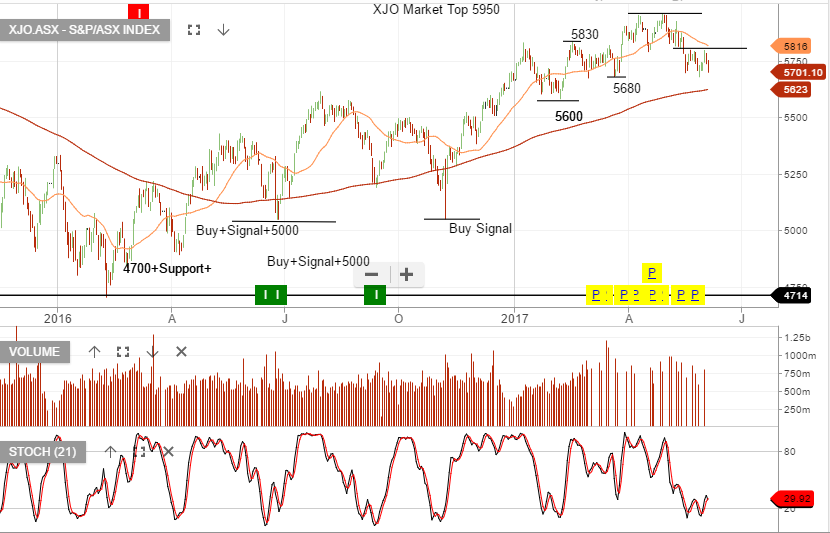
The XJO chart below shows the index breaking-down after finding selling pressure at the recent lower high formation on the 2nd of June.
The XJO chart below shows the index breaking-down after finding selling pressure at the recent lower high formation on the 2nd of June.
Level 17 Chifley Tower
2 Chifley Square
Sydney, NSW 2000
1300 614 002
Investor Signals Pty Ltd
ABN 44 143 555 453