James Hardie – FY17 Earnings Result
JHX reported FY17 results that were below market expectations. EBIT
of US$354m & NPAT of US$249m
At 27x earnings and a 2.6% dividend yield, combined with last week’s deteriorating new home sales data in the US, JHX has been one of our high conviction shorting opportunities.
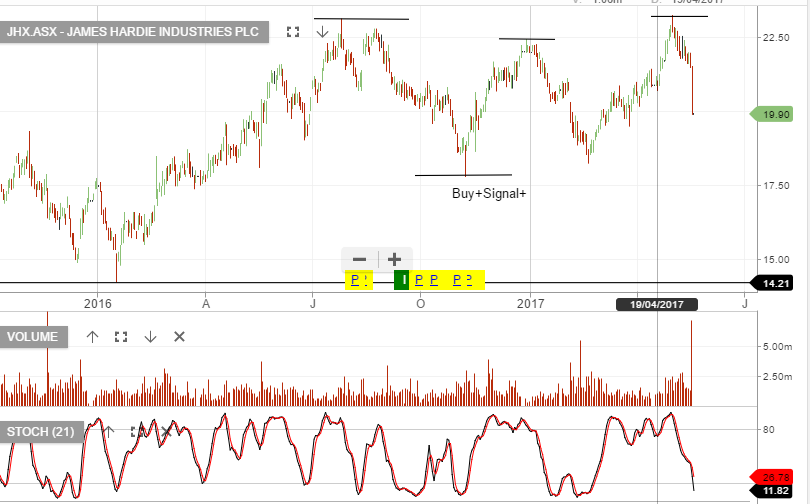
Chart – JHX