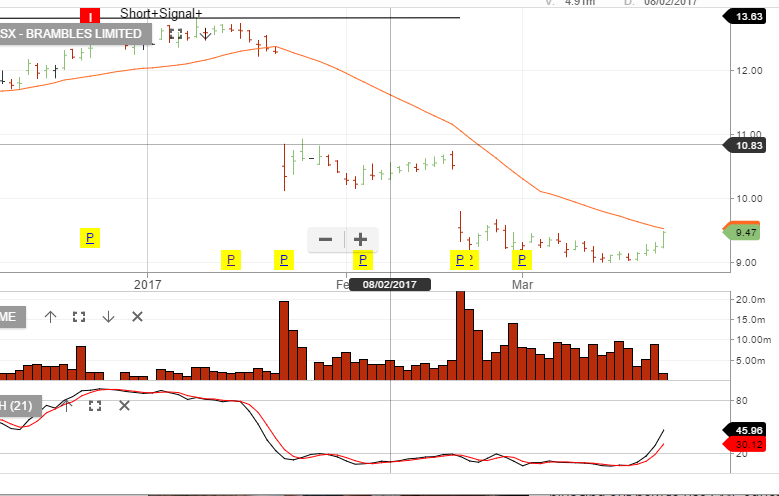
Chart Watch – Brambles
We’ve been buyers of BXB on valuation grounds and have since been aggressive with setting the covered call overlay.
Stop loss required if the price breaks back below $9.00
We’ve been buyers of BXB on valuation grounds and have since been aggressive with setting the covered call overlay.
Stop loss required if the price breaks back below $9.00
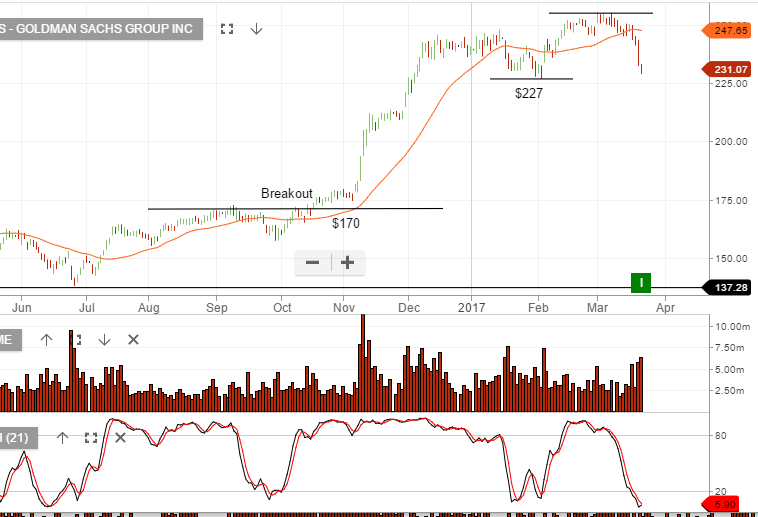
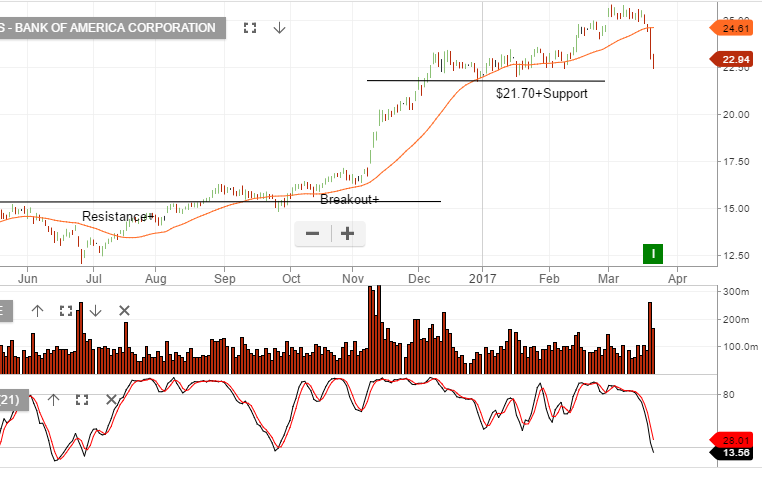
With the recent sell-off in US equities, we’re now seeing a number of Algo long signals appear in the US financial names.
We’re mindful of the “peak optimism” that is priced in regarding tax cuts, deregulation & US economic pickup and approach these buy signals with caution.
We’ll be tracking the short term momentum indicators in Goldman Sachs and Bank of America as a leading indicator to market sentiment.
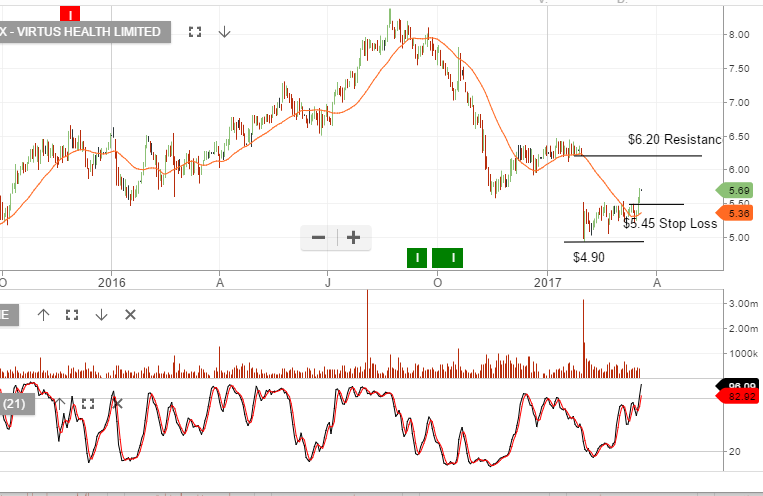
The following chart shows the trading range and stop-loss target on Virtus Health.
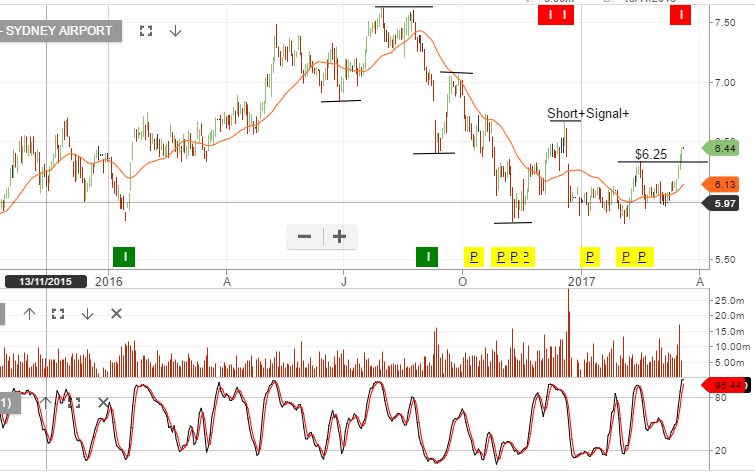
The Algo Engine flagged SYD as a short signal yesterday. At this stage, we’re thinking SYD trades sideways, (rather than lower), and consolidates heading into the June dividend.
With the stock at or near $6.50, it places SYD on a 5% yield and when complimented with a tight covered call, we’re able to generate 12% annualized cash flow. If price breakdowns below $6.25, we’ll reassess the strategy.
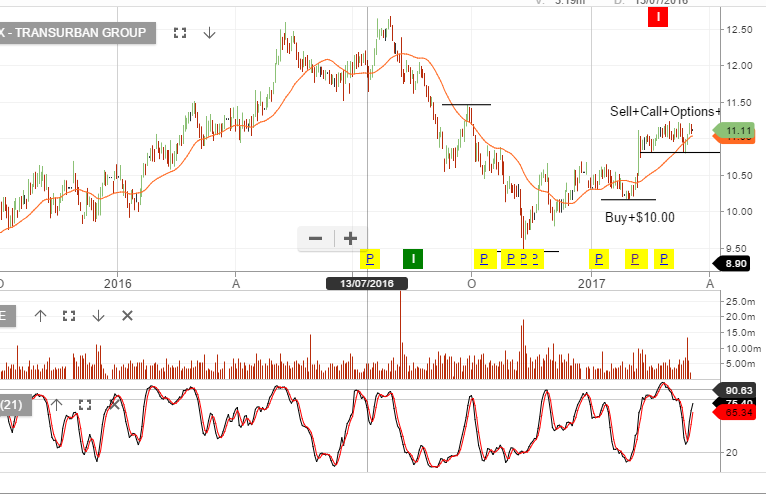
Utilities & REIT’s, (SYD & TCL), are benefiting from US yields retreating from recent highs.
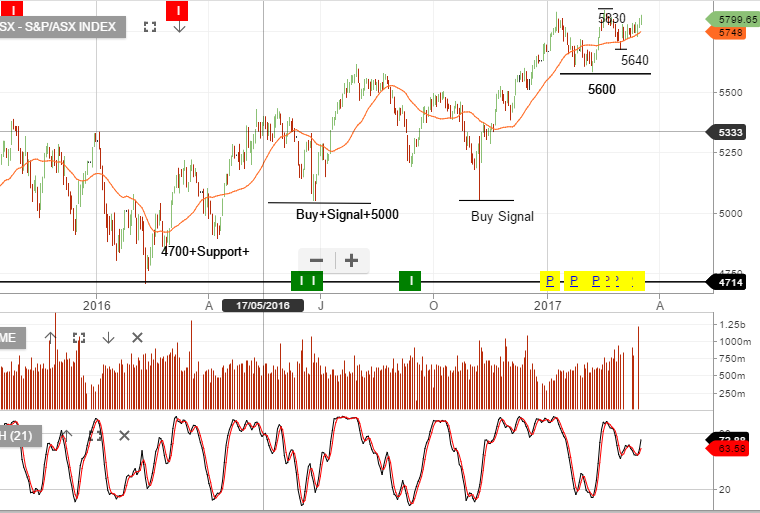
The XJO remains within the 5600 – 5830 consolidation range.
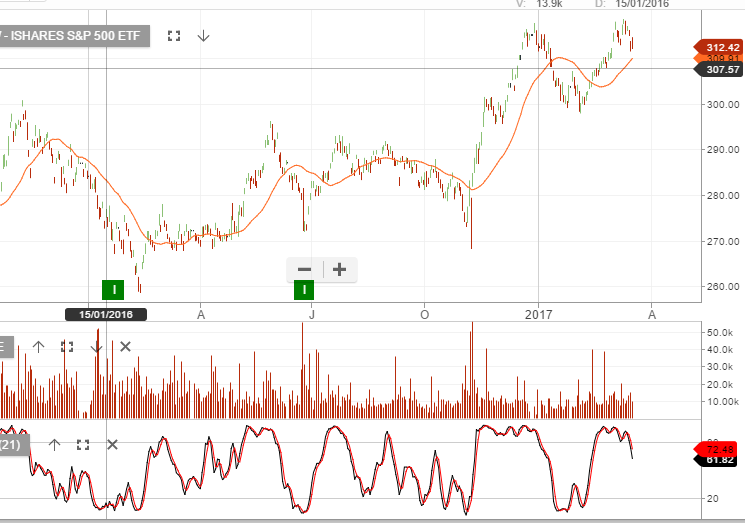
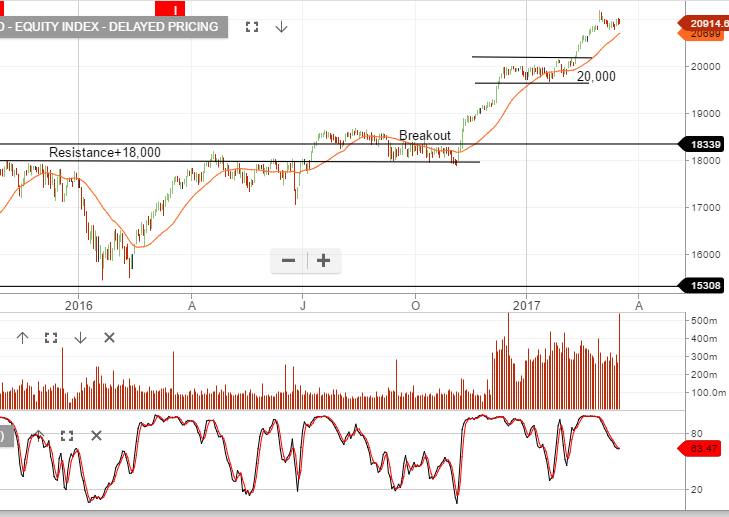
US Stock Indexes closed lower on Friday as option expiration and continued weakness in the financial sector offset gains in the industrial and utility names.
The Financial index finished the day over 1.5% lower with the major banks stocks: JP Morgan, Goldman Sachs, Citi Group and Bank of America all falling by more than 1% by the New York close.
With the SP 500 index now trading at 22 X earnings on a forward yield of just under 2.5%, the medium-term fundamentals don’t appear to support the high level consolidation at these prices.
Technically, the SP 500 index has not closed below the 30-day moving average in over 4 months.
We now see key price support at 2356.00. A break of this level would likely extend back to the February 13th low of 2310.00.
Chart below of Dow Jones Index and S&P500
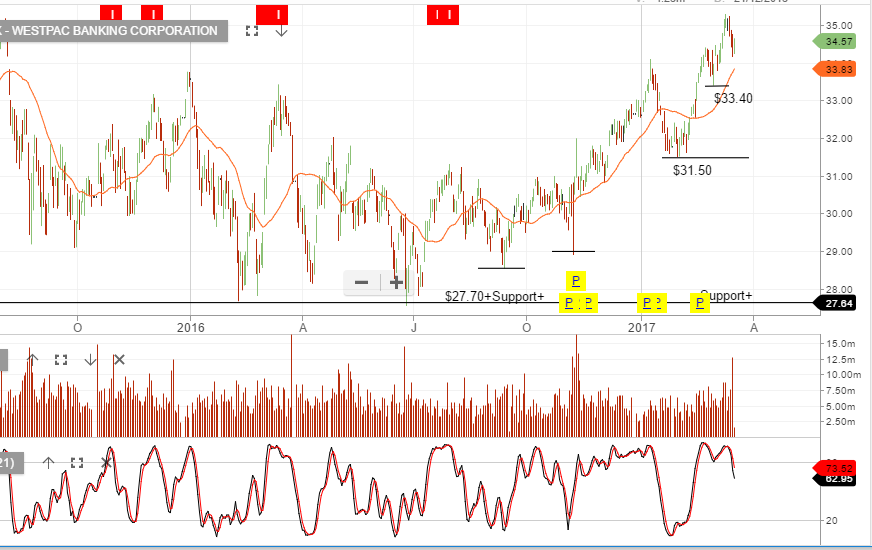
Looking at the recent run up in ANZ, NAB & WBC, it would appear that the stocks are fully valued at these levels.
Either taking profits or selling at-the-money call options to enhance the income, (whilst staying exposed to the May dividend), is a reasonably prudent approach at this time.
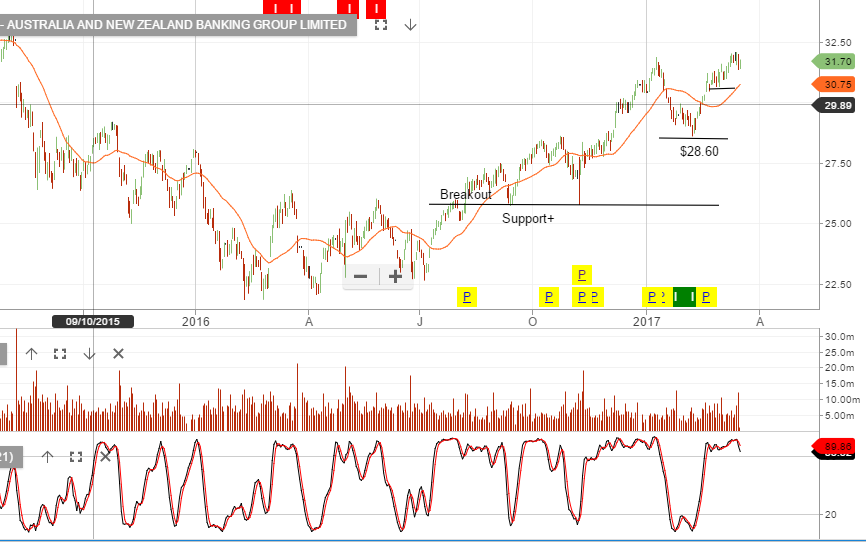 Chart – ANZ
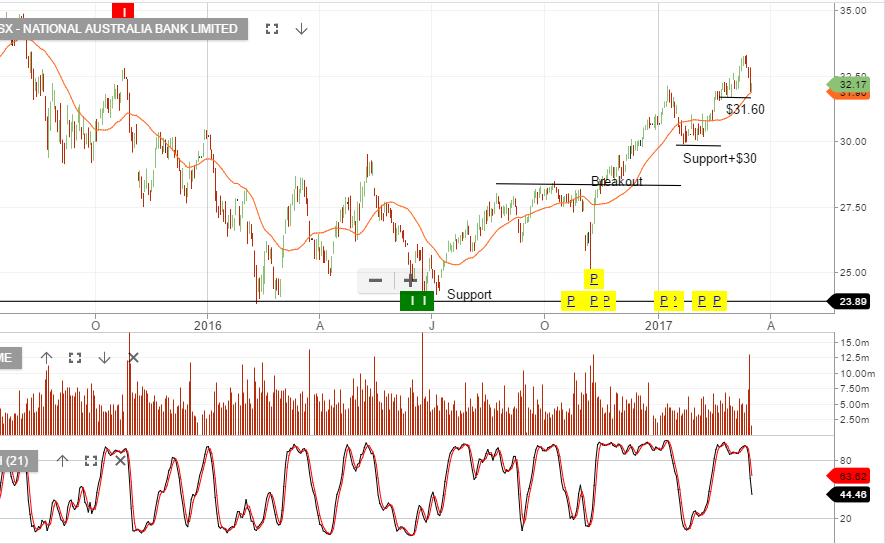
Chart – NAB
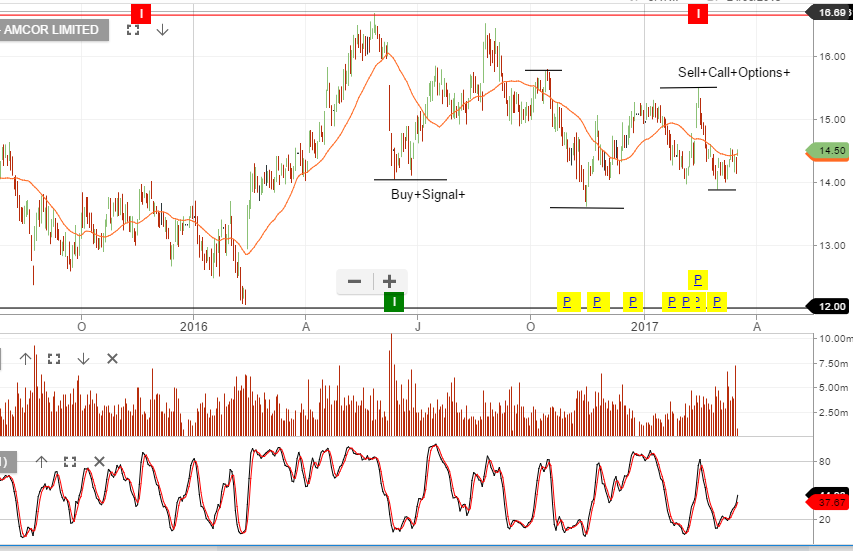
Amcor looks like it is finding support at $14.25 and could trade up to $15.00.
With the stock on a 4% forward yield and earnings likely to grow at 4 – 8% p/a we think this makes a AMC a good buy-write strategy.
The August dividend plus the call option income is generating over 10% annualised cash flow, whilst still allowing 5% capital growth over the next 6 months.
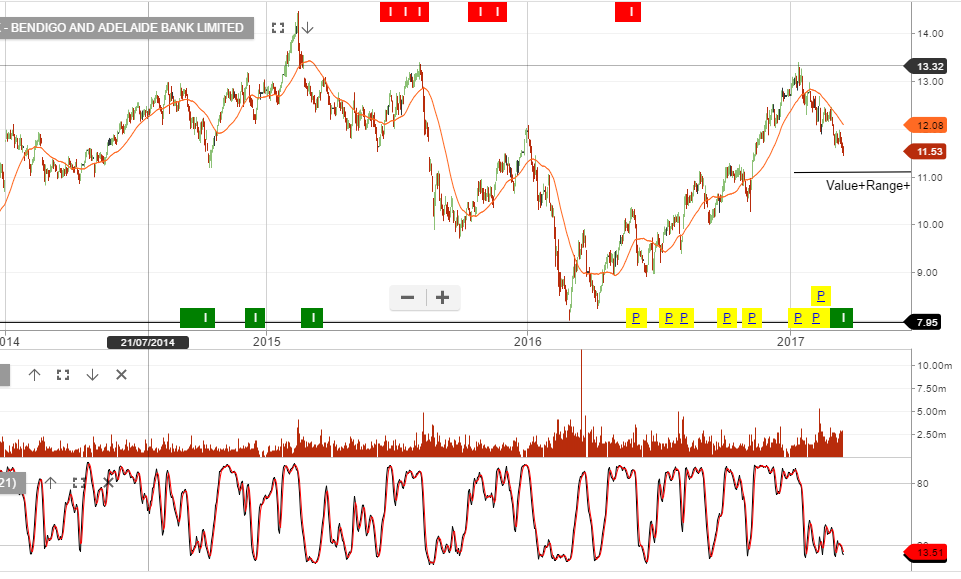
Our Algo Engine is flagging BEN with a technical buy signal.
We’re mindful of the downward pressure on the banking sector following today’s weak employment data.
Therefore, we’re not buyers at present, but we’ll be watching BEN and looking for the short term indicators to turn positive at or near the $11.00 support level.
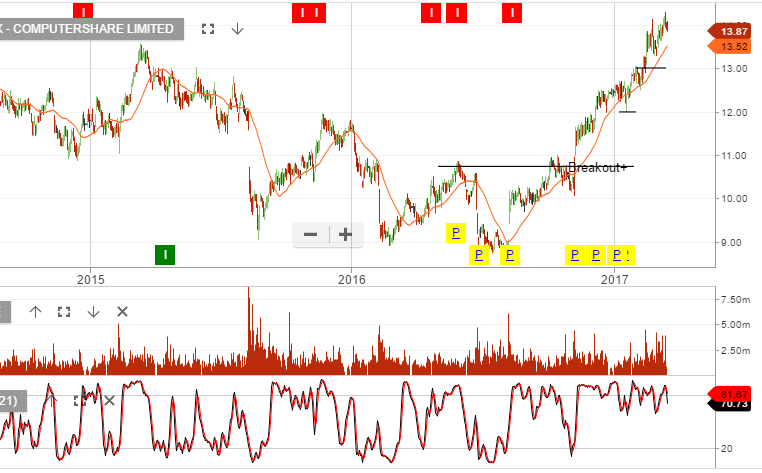
Computershare looks expensive.
We generally don’t participate on the buy-side when it comes to options on individual stocks. However, we do buy index options to hedge portfolios or to make profits on short-term corrections.
In the current environment, when some stocks look overvalued, it makes sense to buy put options on a stock specific basis.
Let’s track these over the weeks ahead as a strategy to profit from a pull-back in the share price of CPU.
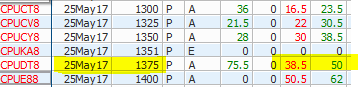
We buy the $13.75 May Put options for $0.45.
Level 17 Chifley Tower
2 Chifley Square
Sydney, NSW 2000
1300 614 002
Investor Signals Pty Ltd
ABN 44 143 555 453