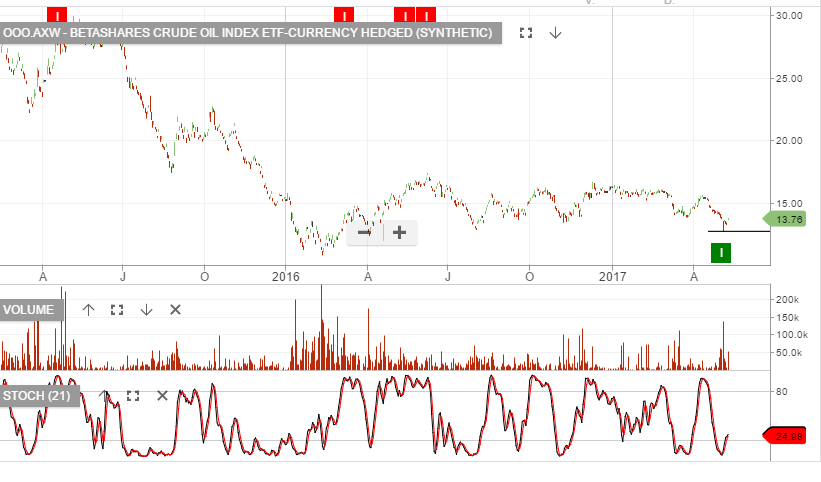
We continue to track the Betashares oil ETF OOO.AXW
Oil prices have rallied from the recent low after this week’s largest inventory drop of 2017. EIA data has revealed U.S. crude stocks fell by 5.2M barrels. In addition, OPEC supply cuts have been agreed to by Iraq and Algeria joined Saudi Arabia.
Concerns regarding the abundant added supply of US shale oil will keep a lid on any meaningful rally, but we may see a bounce from the recent low. Investors should run stop losses under the trend low on both ETF and individual stock names.
Our best performing energy trade has been the long ORG position. However, due to the extended price rally since the Algo Engine buy signal, we’re now inclined to take profit in ORG and consider the OOO.AXW ETF as a replacement.
US Banks have under performed in the last 3 months. With the S&P500 up almost 4% and the banks up on average around 1.5%.
Q1 bank earning reports showed bank loans shrinking since late 2016.
This is likely caused by the first-quarter 2017 GDP growth that was anemic at .7%. Investors are expecting GDP to grow 3% or better during the remainder of 2017, we’re not so sure.
Bank earnings will do well in a environment of 2.5 to 3% plus GDP, anything less than 1% is likely to be problematic. While improving unemployment rates and the Fed’s intentions to raise rates this year, suggest the US economy is doing okay, the slowdown in lending, slowing GDP, rising loan defaults, tighter lending standards may suggest otherwise.
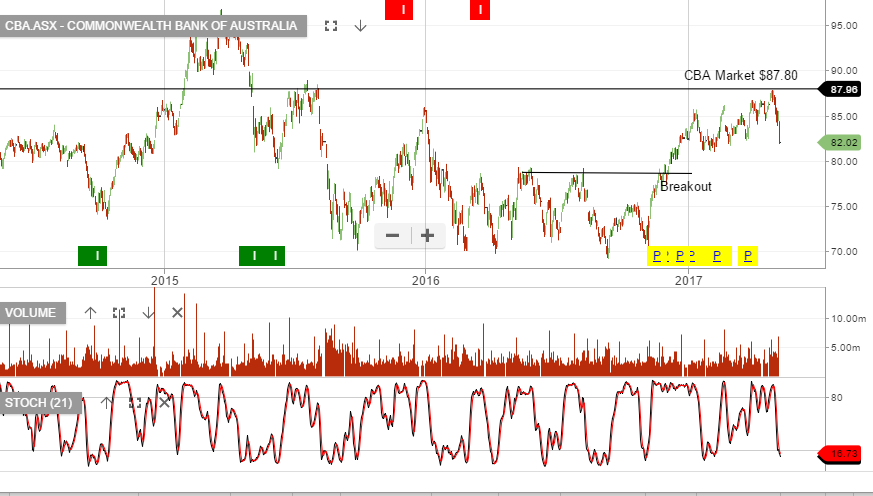
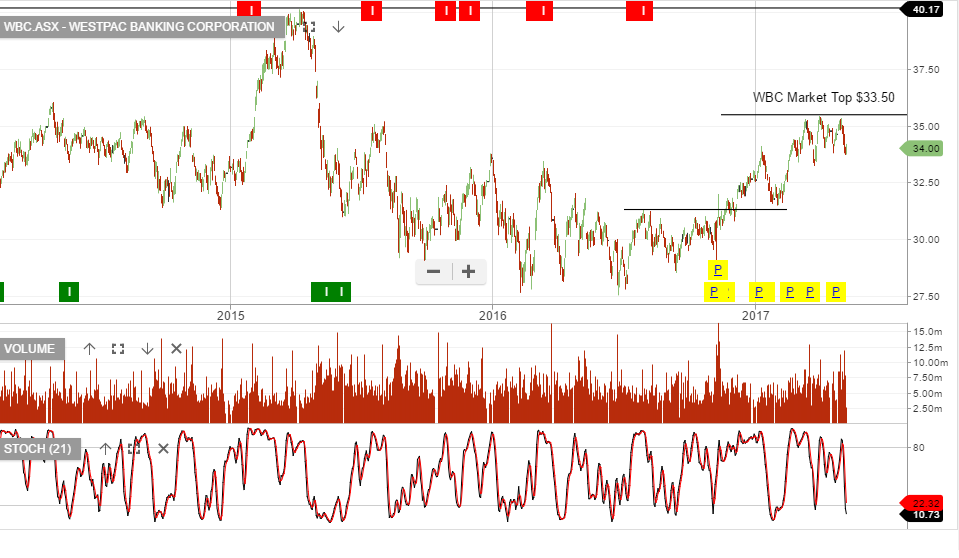
The soft underlying revenue trends which impacted the other major bank results over the last week were obvious in CBA’s Q3 result. Offsetting the weak revenue trends in the major banks has been a strong performance on asset quality.
We see downside risks building around regulatory change & economic weakness leading to higher bad debts.
CBA FY18 forecasts net profit to remain flat at $9.8b, EPS $5.50, placing the stock on a forward yield of 4.9%.
The Algo Engine has triggered a buy signal on the higher low formation in ANZ. We’re happy to look at this from a very short term perspective but remain on the short side of the banks and we’re inclined to sell any technical bounce from the current levels.
NOTE: The Australian Government announced the introduction of the Bank levy in its 2017 budget. Based on the Treasury estimates this levy will raise $6.2billion which will reduce earnings by up to 5% for the majors’.
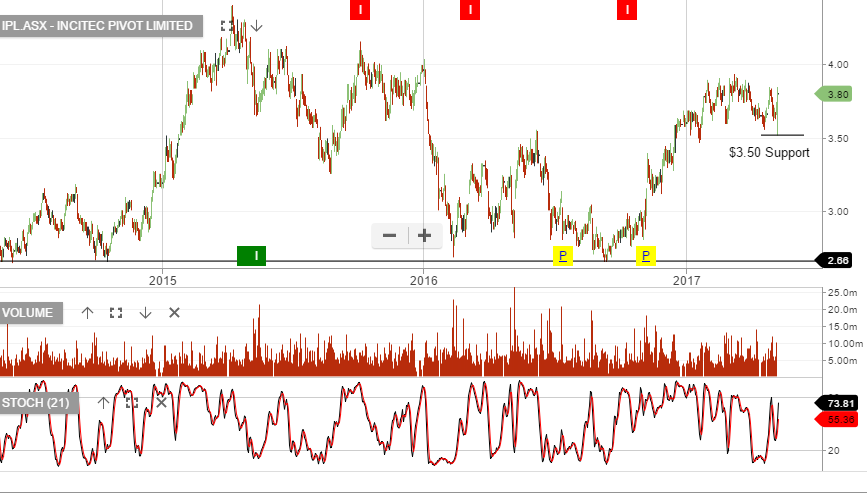
IPL reported 1H earnings of $152m, slightly ahead of market expectations.
IPL’s outlook was the most positive it has been in years. Although, global fertiliser prices have started to soften, with seasonal demand peak in April/May. US ammonia prices to are forecast to trade within the US$300/t to US$330/t. A weaker AUD offers a some upside to IPL’s earnings.
FY18 forecast revenue $4b, EBIT $640m, EPS $0.25, DPS $0.15, placing the stock on a forward yield of 3.7%.
Underlying earnings growth now tracking in the 10 – 20% range.
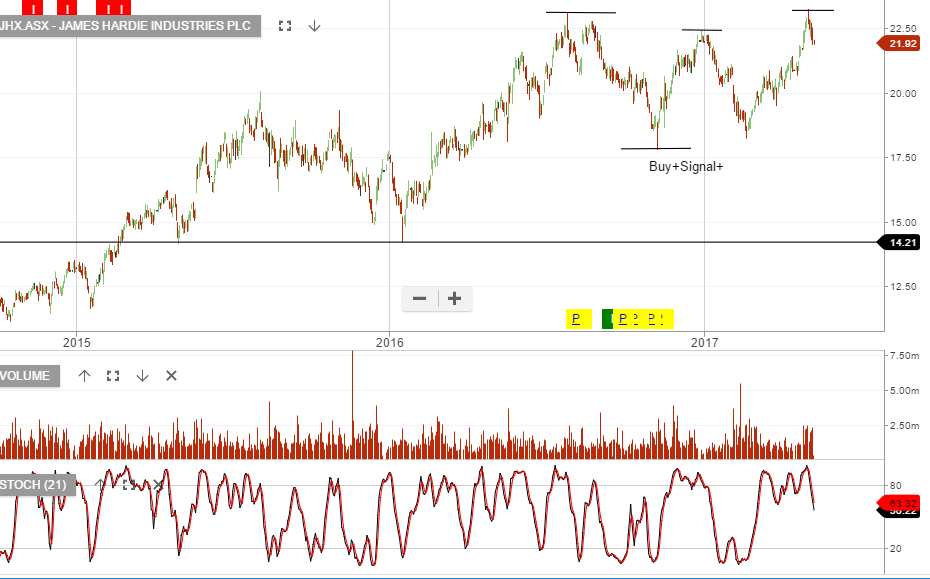
We forecast JHX FY17 NPAT of US$250m vs Management’s guidance of US$245-255.
On FY17 numbers JHX is looking expensive. FY17 EPS of $0.56 places the stock on a PE of 29x and a 2.4% yield.
Based on the current share price valuation, the market is looking for a 30% lift in underlying earnings into FY18, to support an EPS target of $0.72 and a reduction in the forward PE to 22x.
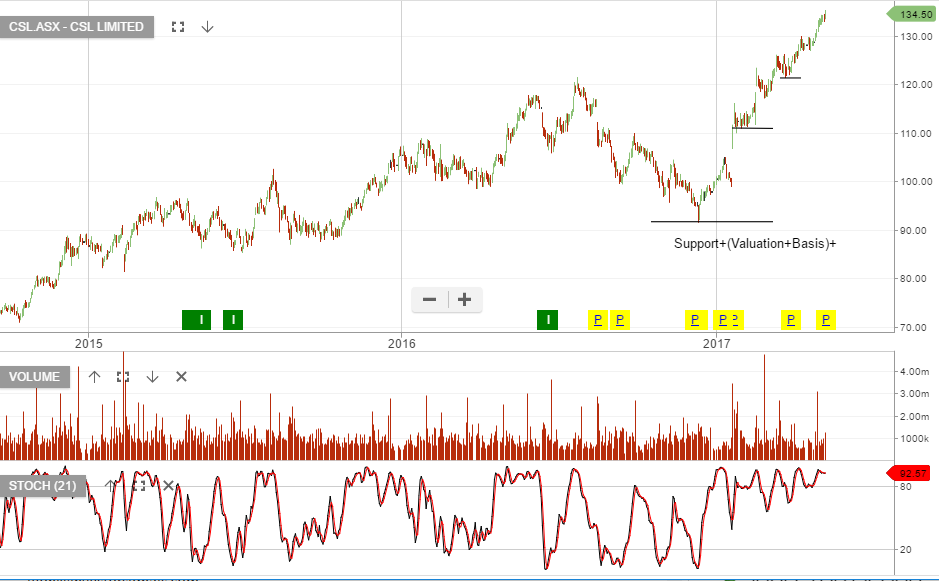
CSL’s FY17 NPAT guidance implies US$1.38b net profit after tax.
The company has purchased 1.4m shares during 2HFY17, of the $500 million share buy-back program.
With the stock price now trading 28x FY18 earnings, much of the good news is priced in. FY18 revenue $7.2b, EBIT $2.2b, forecast net profit up 20% to $1.7b, EPS US$3.60, DPS US$1.75 places the stock on a forward yield of 1.8%.
We remain attracted CSL and look for the next Algo Engine buy signal to provide a discounted entry point.
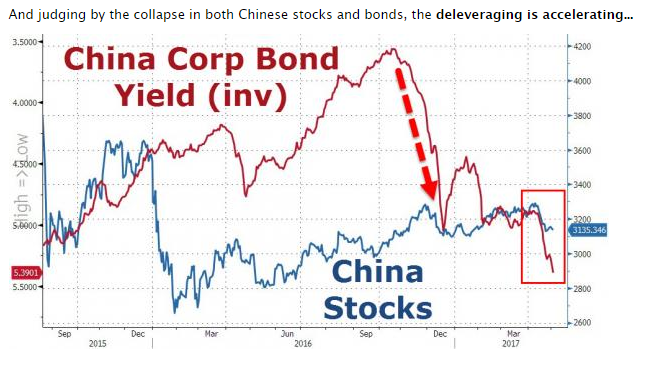
China’s credit system has expanded quickly and there are some concerning signs beginning to emerge. In particular, ballooning assets in Chinese wealth management products could create another credit crisis.
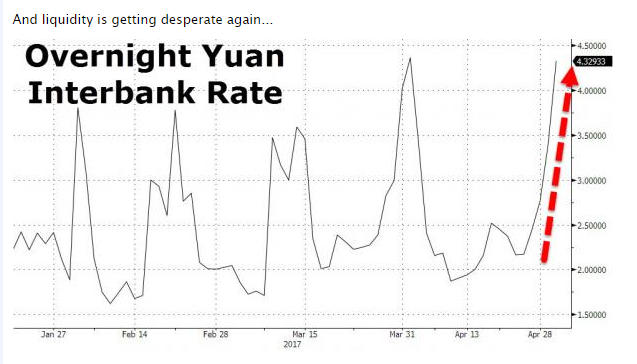
As soon as we see investors opting to not rollover existing investments due to rising risks and defaults, the lack of liquidity will expose under performing investments.
Wealth management products, or WMPs, have swelled to $4 trillion in assets in the last few years against a $34 trillion banking system. This well exceeds the mismatch at the peak of the US subprime collapse.
China Bonds vs StocksChart – Yuan Short Term Rates
Sophisticated Investor?
We have special opportunities available for Sophisticated Investors. If you're interested, and qualify, please provide your details below.