Early Days on The Bank Hedge

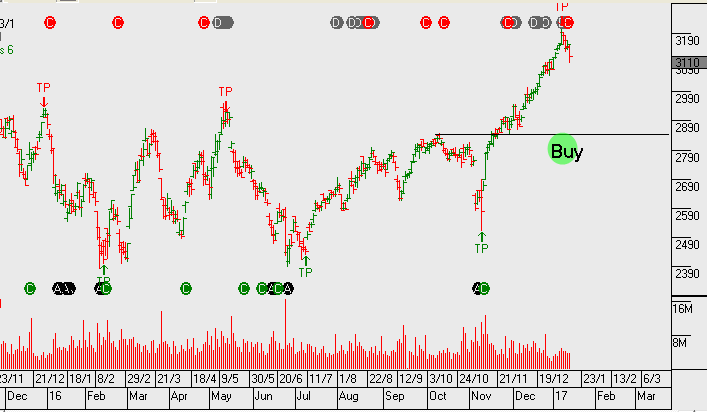
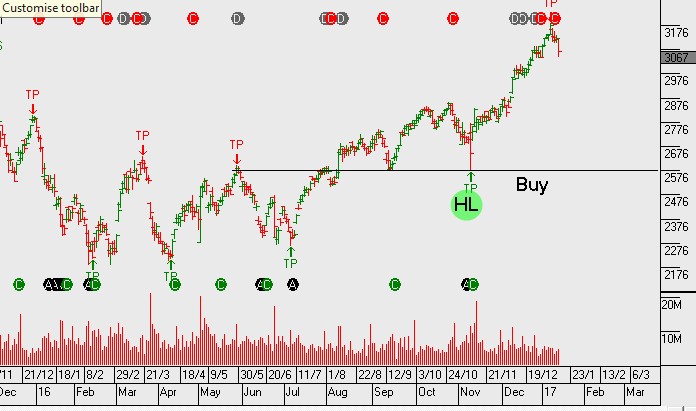
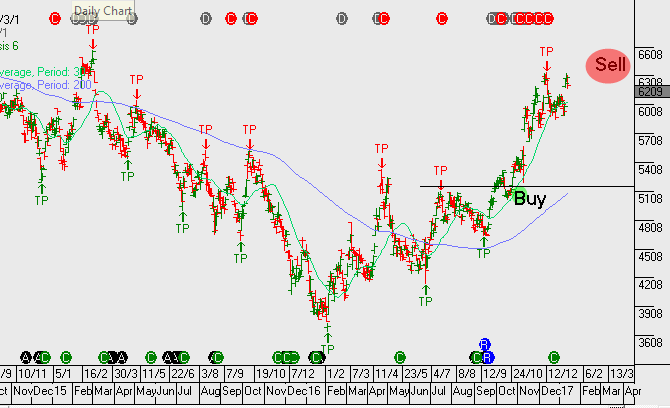
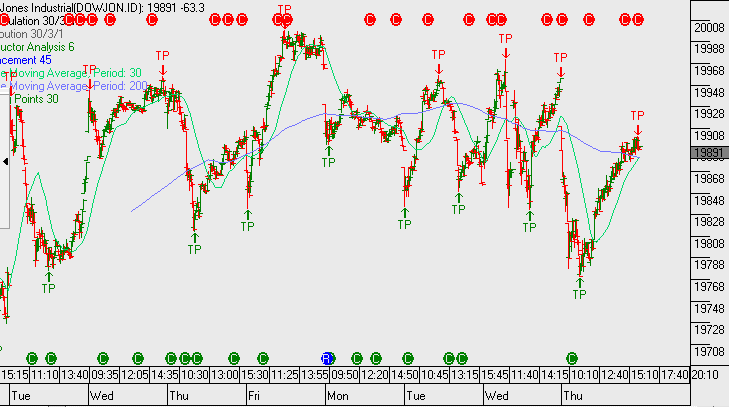
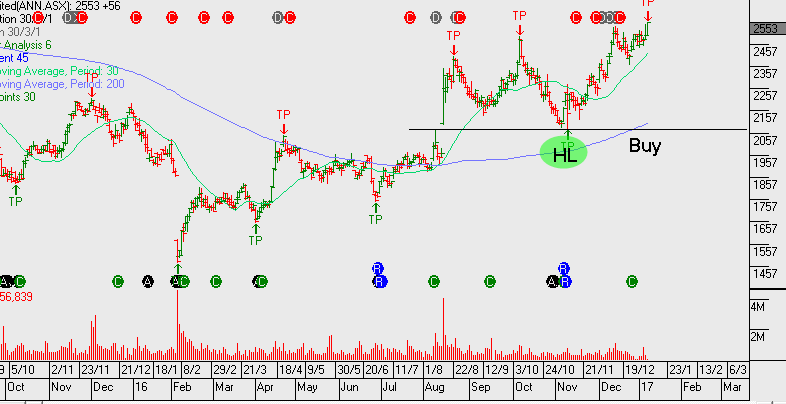
We’ve been running a hedge on the Australian banks; CBA through an in-the-money European March option, NAB using an in-the-money American February option and WBC a longer-term call option. In ANZ our preference has been to exit the trade altogether.

On Friday, our domestic banks started to see some profit taking and the catalyst could’ve been selling ahead of the US banking results and/or the announcement of weaker export data out of China.

JP Morgan and BoA’s results , released last night, were adequate on the bottom line but both companies missed on the revenue front. Increased dividends and share-buybacks helped support what otherwise would’ve been viewed as weak results.
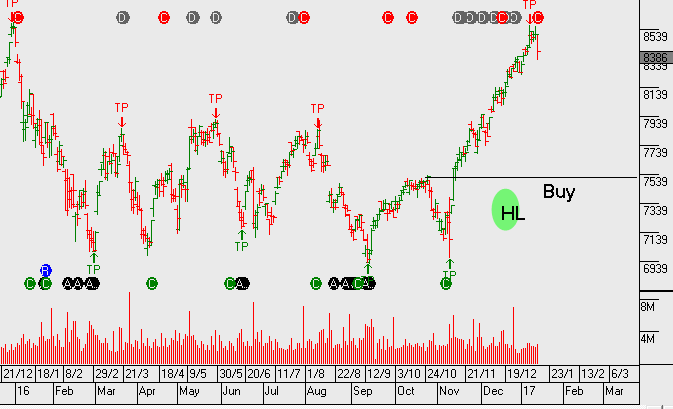
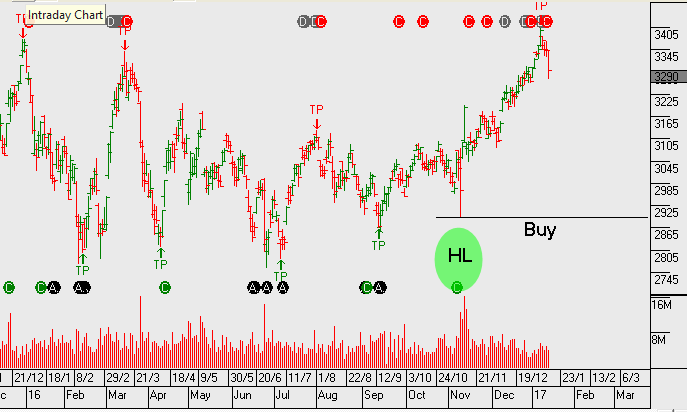
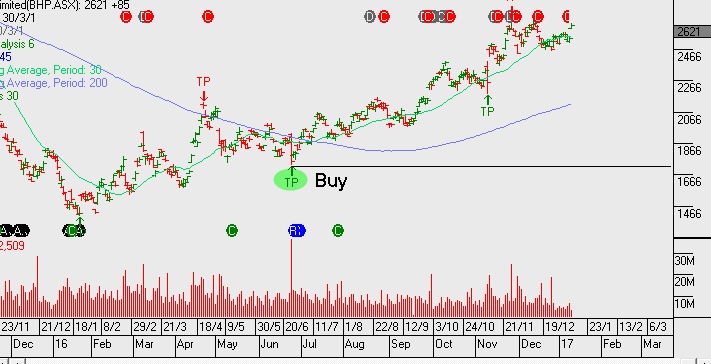
Chart – CBA
Chart – WBC
Chart – NAB
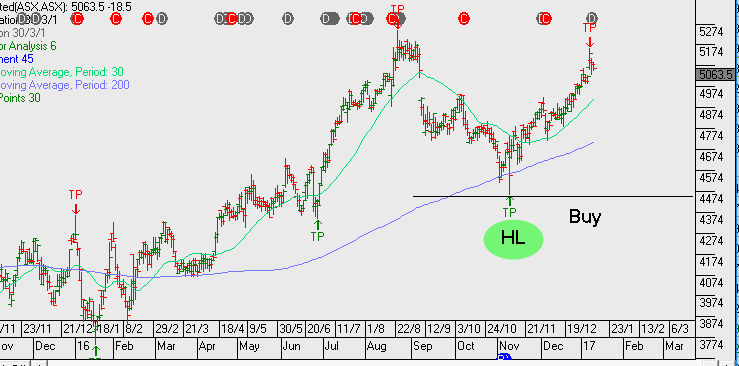
Chart – ANZ


RIO – Q4 Production Report

On balance, 2016 wasn’t a bad year for RIO Tinto. After posting a 7-year low at $36.50 on February 1st, shares of the mining giant closed out the year just below the $60.00 mark (a 64% gain).

This impressive turn-around was supported by a broad rebound in Iron Ore, Copper, Coal and Aluminium. Rio has an impressive portfolio of assets. It anticipates solid growth in Iron Ore production in 2017, with a large copper project coming online over the next decade.

The company has a market cap of just under $80 billion.

On Tuesday, RIO will release its Q4 2016 production report. We expect the report to show a modest 1% lift in quarter-to-quarter production, driven primarily by Q4 strength in Iron Ore production and shipments from the Pilbara.

In addition, forecasts expect RIO to have lifted group production by 5% YoY in 2016, with strong gains in Copper (3%), Iron Ore (6%) and Aluminium (10%).

We also expect RIO to lift group production forecast by a further 7% for calendar year 2017.

In FY17, we expect revenue to up 5% to $37b, net profit up from $5.2b in FY16 to $7b in FY18. EPS will increase from $2.90 in FY16 to $4.00 in FY18, helping to push the dividend yield from the current 3% to almost 5% in 2018.

We’re keeping exposure to resources and selling tight covered calls 5% above current market valuations.

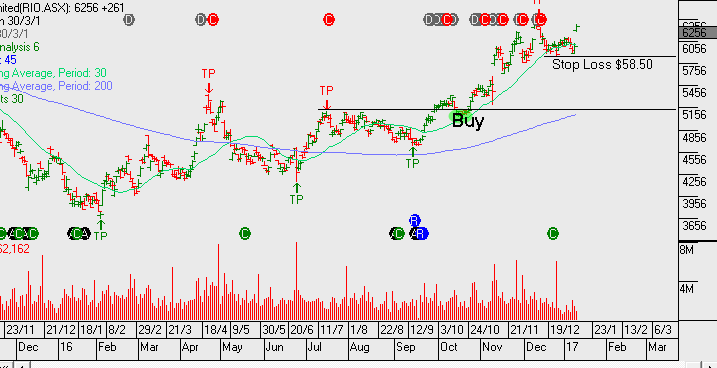
Chart – RIO

Dow Jones – Eve of US Bank Earnings

As investors we rarely need to take much notice of intra-day graphs. However, I’ve attached the Dow Jones 5-day graph which shows the price behaviour rolling over, heading into tomorrow’s bank results.

Short-term traders and index investors, (both long and short), will find the chart and strategy outline shown below of interest. As too, would someone running a dynamic portfolio hedge using futures, index options, etc.

The chart pattern shows the recent “lower high and lower low” selling pattern as the index hit resistance just below 20,000. This big number has little relevance to us and is of no real interest. What’s more interesting is the pattern leading into tomorrow’s US bank earnings.

Traders may form a view that staying short the index as long as the price pattern stays below the 19,980 level is warranted.

From an investor perspective, we remain cautious of global markets based on current valuations and increasing macro risks. We continue to position defensively and use covered calls to deliver returns without pursuing an overweight “growth” portfolio allocation.

Chart – Dow Jones

Australian Bank Profit Announcements – Key Dates

Bank profit announcements start in February with the following key dates worth noting.

SUN 9 February, BEN 13 February, CBA 15 February along with 1Q17 trading updates from ANZ and NAB in February.

Following the recent rally in bank shares, we see the current trading range as full value, therefore, placing the banks at risk of being buffeted by any increase in market volatility.  Although net interest margins have improved, the prospects of earnings growth is modest with the outlook between 1% – 4% growth at both top and bottom-line.

We also remain concerned that the cycle for bad debts is likely to rise from the current historic low levels.

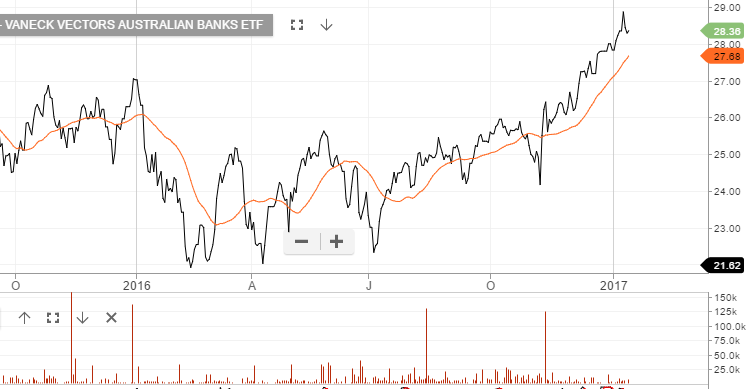
Charts – Aust Bank ETF


Oil and Metals

Copper prices jumped today as Chinese inflation data picked up last month, sending a reassuring signal about demand from the world’s largest consumer of industrial metals. China’s Producer Price Index rose 5.5% last month, which was better than the market expectation of 3.3%

The forward month red metal was up 2.9% at $2.60 per pound, posting its largest one-day gain in two months on the COMEX exchange in New York. A reduction in copper stocks at the LME will add short-term support to the upside for prices.

We expect to see firm resistance in the $2.74 area, which represents a “double top” chart pattern dating back to November.

A surprise jump in US inventory data extended the recent down move in crude oil prices. We now see solid support around the $50.00 level.

We still like the long side of oil names but feel investors should be adding covered call options to WPL and OSH to enhance the yield.

We’ve allowed upside to $27 in BHP and upside in RIO to $63 before capping out our short term gains.

Chart – BHP
Chart – RIO


Woolworths – Valuation Review

Woolworths has recently sold their petrol business to BP for $1.8b which helps to underpin the groups balance sheet. As a result, we’re likely to see Woolworths accelerate their store refurbishment program.

In late February we’ll see the earnings update from Woolworths and based on consensus numbers we expect $58b in revenue, EBIT of $2.5b with reported profit around $1.5b.

On a forward basis the underlying earnings growth should track around 4% with FY18 EPS of $1.30 and DPS $0.88, this will place the stock on 3.7% yield.

Any rally in the share price following the Feb result, we feel adding a covered call at or near $25 – 26.50 offers a suitable risk reward payoff.

Chart – WOW


ASX – Earnings Review

Shares in ASX have performed well since the Algo buy signal in early November.  If we look out 12 months, ASX should deliver revenue in FY18 of $850m and EBIT of $600m. The business is growing at around 5% p/a and management are remaining disciplined on cost control.

From an earnings per shares basis,  FY18 EPS will increase from $2.30 in FY17 to $2.45 in FY18, and DPS will increase from $2.10 in FY17 to $2.20 in FY18. This places ASX on a forward yield of 4.3%.

We think ASX shares are trading at the top end of the valuation range given the compressed yield and moderate EPS growth. The upside still remains the potential of a take-over bid as global exchanges look to consolidate.

Chart – ASX


Export Surge – First Trade Surplus in 3 Years

Last Friday, Australia posted its first trade surplus in nearly three years.

The surplus of international goods and services was $1.2 billion for the month of November, which was much better than the market forecast of a $500 million deficit.

The Australian Bureau of Statistics said exports surged 8% in November, while imports were flat. The main drivers for the gain in exports were iron ore and coal, which rose 11% and 25%, respectively.

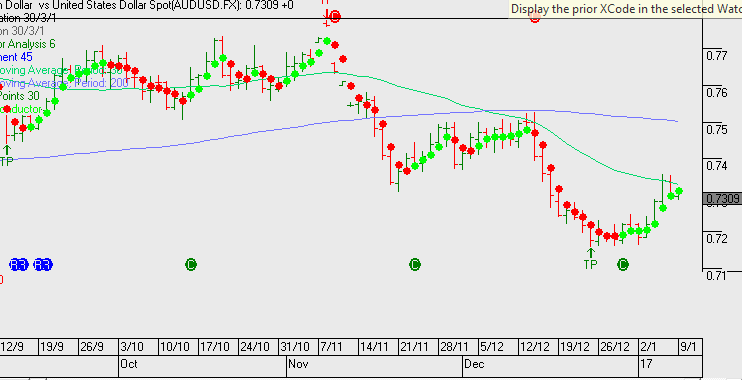
This is positive for the fundamental picture in the Aussie Dollar. We see solid support in the .7290 area with the scope for a move up to the .7430 level in the near-term 

Chart – AUD

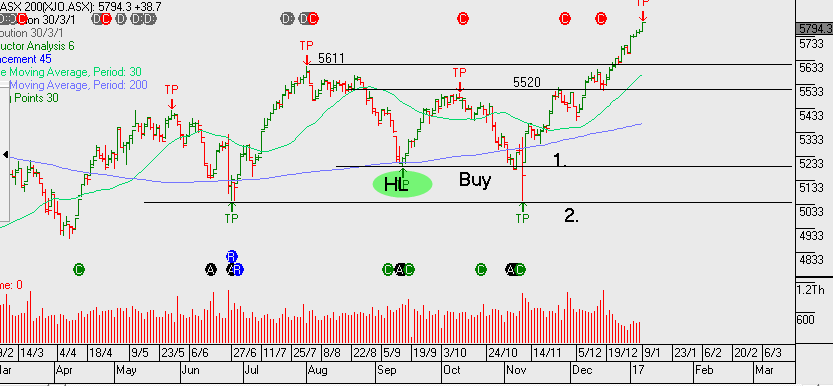
Chart – XJO

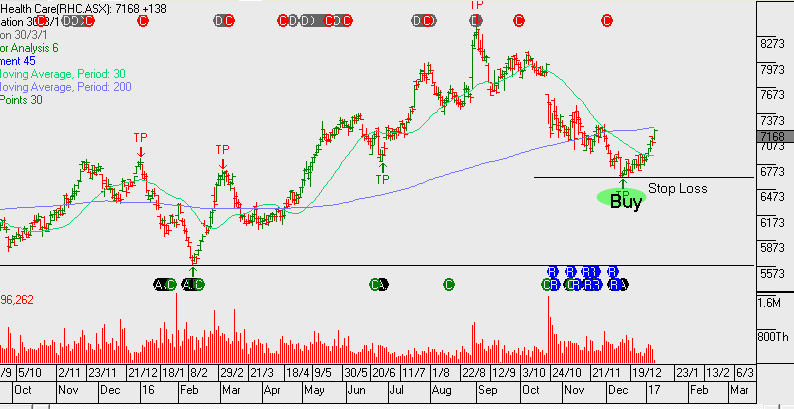
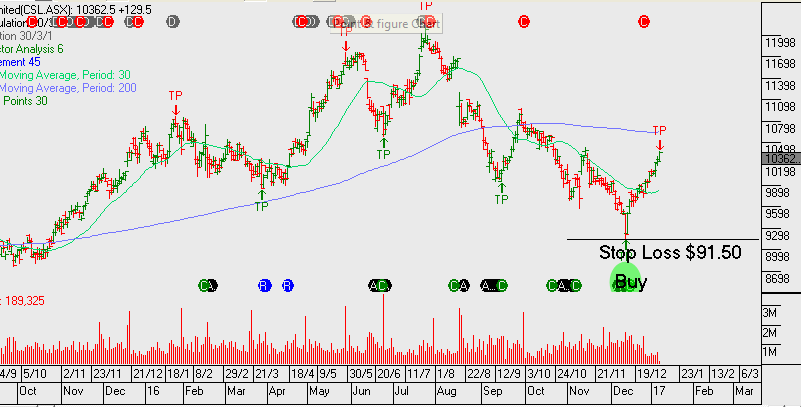
Healthcare Algo Buy Signals

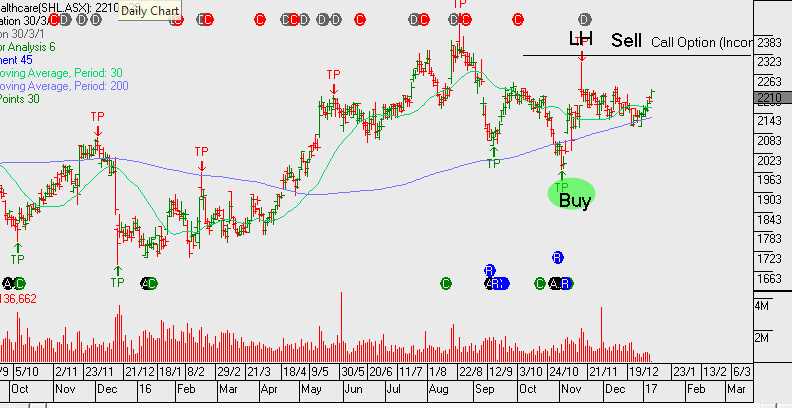
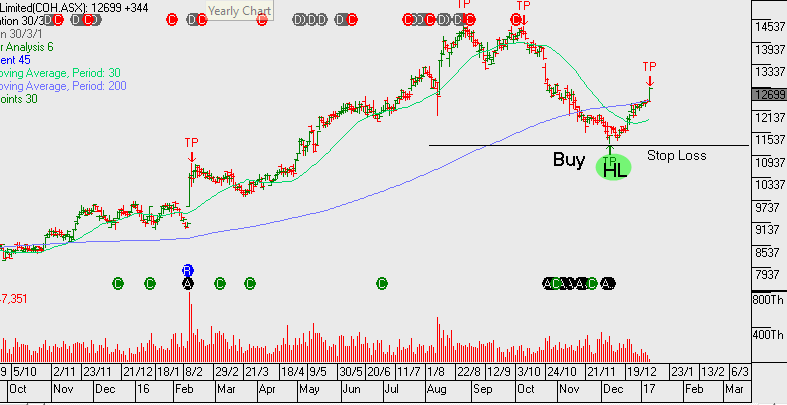
At this point in the market we prefer healthcare names as a sector allocation for new money. Here are the recent buy signals generated by our Algo Engine.

With SHL, CSL and ANN we’ve added covered calls to boost the annualised cash flow to over 10%, whilst still allowing for capital growth if exercised at the strike price of the sold call.


Chart – SHL
Chart – COH
Chart – RHC
Chart – ANN
Chart – CSL

Dow Jones Index – This Warrants A Closer Look

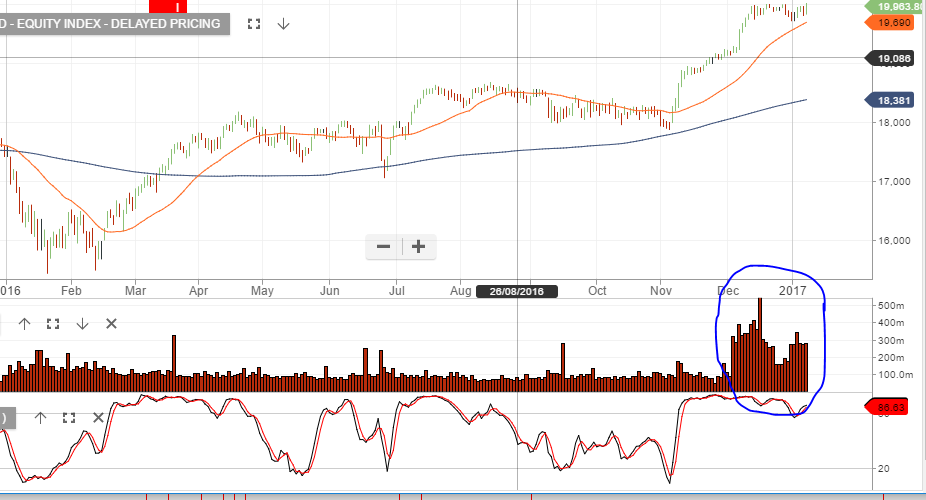
We’re interested in the large pickup in traded volume over the past few weeks in the Dow Jones Index. By any measure the volume is abnormal, even compared to prior end of year volume traded.

The conclusion we draw from this is: whilst ETF’s are helping to accelerate index volumes, it seems a reasonable conclusion that it could be part of a series of indicators which are helping to suggest that we’re near an exhaustion point in the US equity rally. We’ve seen market tops coincide with big volume distribution patterns like this before.

Chart – Dow Jones