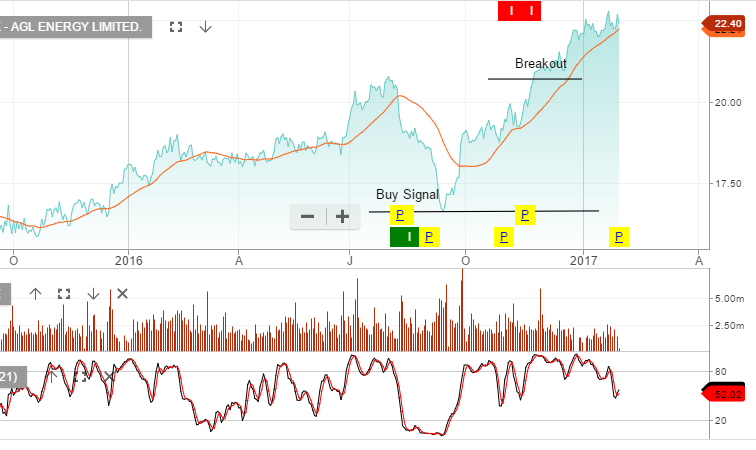
AGL Outlook

Several market commentators have focused on AGL as an Utility Stock ready to make a strong move higher; we aren’t as confident.

While the AGL stock price has rallied over 25% during the last 12 months, the source of these continued gains are based on increased earning expectations as the increase in electricity costs roll through to both consumers and business users.

Further, AGL bulls are relying upon improved fundamentals within the electricity market to support elevated prices.

Our view is that the expected jump in earnings and dividends per share will be hard to attain and that a sideways trading pattern between $20.00 and $22.50 is a more likely outcome over the medium-term.

Chart – AGL

QBE Higher On Merger Talks

Shares of QBE have jumped over 5% in early trade, posting a new 15-month high of 12.97, on rumors that the firm was in formal merger talks with insurance giant Allianz.

According to an article in a German newspaper, the CEO’s of the two companies met before Christmas and Allianz made an informal offer of $15.00 per share for QBE.

This offer price represents a 20% premium to QBE’s closing price on Friday. Aside from this merger rumor, the stock has had a steady increase since early November as US bond yields have move higher.

Without any further clarification about the merger talks, we would expect technical resistance to be seen in the  $13.25 area.

Chart – QBE

ASX200 – XJO Technical Review

The XJO has bounced off Monday’s low of 5600 points. A combination of the US indices trading modestly higher and the short term oversold conditions in the Australian banks, lead to the minor rally in the XJO. However, with relatively weak top line revenue growth in the US, we still remain cautious on the expected price action in the week ahead.

A break above 5830 will be bullish and a rollover in price around 5750 followed by a later break of the 5600 support will be quite negative.

Chart – XJO


BHP Production Results

BHP’s recent production results were on the weak side, with lowered expectations in metallurgical coal, energy coal and copper.

The firm has cut its guidance for copper production by 2%, but has maintained their FY 2017 production guidance for other commodities. Copper and energy coal were the weakest spots, with those numbers missing analysis’ forecasts by 11% for both commodities.

Metallurgical coal output was 7% weaker than forecast, while Iron-ore and petroleum production was broadly inline with expectations.

Based on these numbers, BHP will need to deliver a significant uplift in production rates during the 2nd half of 2017 for copper and coal if the upper-end of their guidance is to be achieved.

We believe that BHP is up for the task. At current prices, shares are trading on +11% free cash flow and have a positive chart pattern over the last 12 months. Despite the weaker production result, we see scope for a move to $28.00 in the medium-term.

Chart – BHP

MacDonald’s Q4 Results

Despite a solid Q4 earnings report, shares of MacDonald’s Corporation ended the day flat at $121.30.

The fast food giant posted Q4 earnings of $1.44 per share on quarterly revenue of $6.03 billion, which represents a 2.1% increase in earnings and a 10% increase in revenue versus the same period last year.

These Q4 numbers surpassed the expectations of $1.41 per share on revenue of $5.98 billion.

The revenue numbers show a mixed result with company-owned restaurants falling 9% to $3.65 billion, while franchise-operated restaurants grew 3% to $2.38 billion.

Our Algo Engine flagged a short signal in December at $123. We’re watching the price action closely as technically the share price has seen resistance in the $123.00 area.


Chart – McDonalds Corp

Amcor – Technical update

On February 13th, Amcor will report profits for the July – Dec 2016 period.  We’re looking for the net profit to beat market consensus of $300m.

AMC trades on 17x PE and 4.2% forward yield.

We hold Amcor in our investor model and have been aggressive with selling  the covered call strategy. Whilst we like the defensive qualities of the business, it’s at the top end of our valuation range.

Through adding the covered call option we’re generating 10% cash-flow from the dividend and option premium.

Chart – Amcor


BHP – Production Report

BHP will release its 2Q FY17 production report tomorrow. We anticipate the strength in iron ore, coal and copper will likely see production tracking in-line with FY17 guidance.

The forecast for FY17 revenue of US$40b and net profit of $6.8b should generate an EPS of $1.25, which will  place the stock on a 3.3% forward yield.

We remain long BHP with covered call options at or near $28 into April/May as our preferred strategy.

Chart – BHP


ResMed – Beats Expectations

ResMed beat expectations by reporting Q4 earnings of 73 cents per share on quarterly of revenue of $530.40 million. During the same period last year, the firm earned 69 cents per share. This represents a 16.7% increase in revenue from the same period last year.

The street had estimated earnings of 70 cents a share on quarterly revenue of $518.60 million.

These earnings and revenue figures represent a return on equity of 23.10% and a net margin of 17.87%

We started buying ResMed last week, ahead of the earnings release. We’re now up 6% from our entry level and will look at add covered call options to further enhance the return.

Chart – RMD

XJO – Technical Update

After an 8 year bull market we’re becoming increasingly concerned about equity valuations over the next 3 to 12 month. There are concerning signs in markets and these are starting to show up in the charts.

Many large-cap US stocks are showing a “rolling-over” style technical pattern. Following GE’s earnings result last week, along with recent Chinese export data, we’re getting a sense that risks are building.

We’ve used the recent rally in banks as an opportunity to take profits and re balance portfolio’s towards defensive names. We’re also adding short exposure through index ETF’s over the XJO and S&P500.

Chart – XJO

Chart – GE