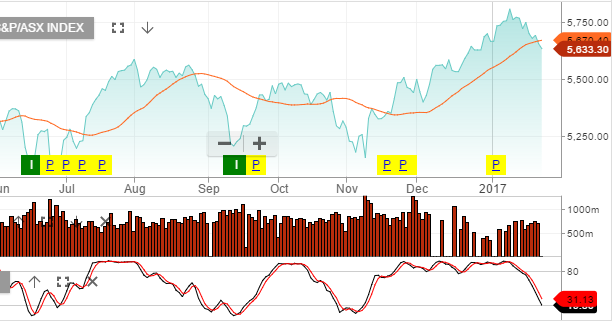
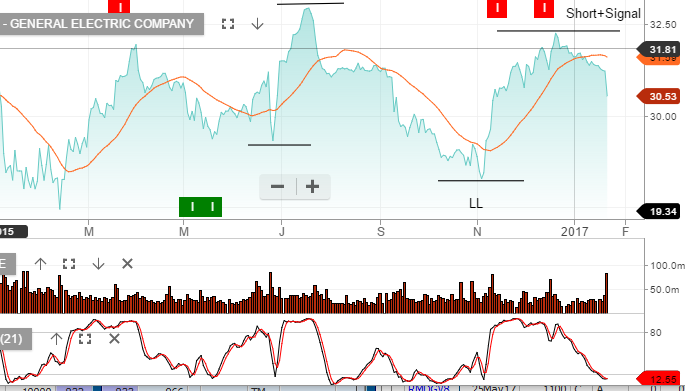
After an 8 year bull market we’re becoming increasingly concerned about equity valuations over the next 3 to 12 month. There are concerning signs in markets and these are starting to show up in the charts.
Many large-cap US stocks are showing a “rolling-over” style technical pattern. Following GE’s earnings result last week, along with recent Chinese export data, we’re getting a sense that risks are building.
We’ve used the recent rally in banks as an opportunity to take profits and re balance portfolio’s towards defensive names. We’re also adding short exposure through index ETF’s over the XJO and S&P500.

Chart – XJO

Peter Ralph says:
Hi Leon,
I’m not sure if we have been in a bull market? The XJO is still to take out the pre GFC high so I doubt it meets Dow’s definition of a new bull market. Further, in eight years we have not managed to even double the GFC XJO low, whereas the Dow has made new all-time highs and trebled in that time. We were at 5,996 on the XJO two years ago and we’re now at 5,624. If we’ve been in a bull market it’s certainly been feeble.
Cheers,
Peter