ASX Opportunities in Review – Webinar Replay
If you missed yesterday’s webinar, then you can watch it below.
If you missed yesterday’s webinar, then you can watch it below.
In our next webinar, I will review high conviction ASX buy and sell opportunities from the recent algo engine and model portfolio signals.
If you cannot make the time, then register anyway and we’ll email you a link to watch the replay.
One of the first lessons that we learned working on a dealing desk is that instability in sovereign bond markets can create sudden turmoil across a wide range of financial products.
The reason for this is because the aggregate amount of global bonds outstanding dwarfs the value of all the shares of stock in the world, combined.
Last Tuesday, global financial markets were spun into a frenzy as Italian sovereign bond yields exploded to the upside.
The catalyst for the move was President Mattarella’s rejection of the new government’s candidate for Finance minister, Paolo Savona.
Mr Savona is an outspoken critic of the EU and the Euro currency
As a result, Italian 2-yr bond yields rose from .68% to 2.42% in one day. That’s a rise of 250% in just 24 hours!!
Looking past the political aspect of this week’s events, Italy is well on its way to becoming the next financial basket-case in Europe.
Regardless of who governs Italy, the country will need to re-finance over 350 billion worth of debt maturities and close to 300 billion worth of non-performing loans over the next five years.
We consider the ongoing debt stress in Italy as a potential source of contagion for global equity markets, including the ASX 200 Index.
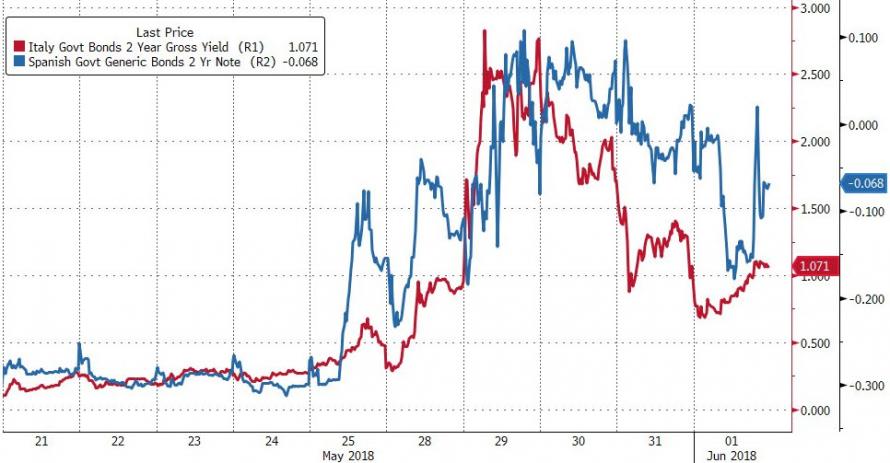 Italian Sovereign Yields
Did your miss our Webinar last night on our Charts and the Algo Engine? You can watch the replay below.
Our final webinar in the 3 part series will be held on Wednesday the 13th of December 2017 at 12:30pm QLD time, 1:30pm NSW/VIC time and 1:30am WA time. This is a daytime session. The topic will be Trading ASX 50 CFDs with Saxo Go.
If you missed our Webinar last night, then you can catch up by watching it here.
Our next Webinar is this Thursday night – Register Now.
Join us in this webinar as we explain the new features and best ways to navigate through the research, charts, algo engine & new model portfolio features. You’ll also be invited to a 30-day free trial of the technology.
Don’t miss the opportunity to build your understanding on how to benefit from our new technology, as your window to the market.
Join us in this webinar as we look at shorter-term trading strategies for both long & short positions & we review how we utilise the Saxo Trader Go platform to take advantage of trading opportunities within the ASX top 50 stocks. We explore the features, how to place and manage orders and look at how short term traders can use the Investor Signals’ research to trade both long and short signals using CFD’s.
Don’t miss the opportunity to learn how we apply proven techniques to shorter term trading on ASX 50 CFD’s.
In December, we are conducting the following webinars. Please register your interest by using the register link below. We will email you, one hour before each Webinar begins, with the link to join in.
Join us in this webinar as we recap on the major trends of 2017 and explore which ones will continue in 2018 and which ones have come to an end. Find out what stocks to add and what stocks to remove from your portfolio, before it’s too late.
Don’t miss the opportunity to build your understanding of the big trends impacting equities and, more importantly, which stocks should and shouldn’t be in your portfolio heading into 2018.
Join us in this webinar as we explain the new features and best ways to navigate through the research, charts, algo engine & new model portfolio features. You’ll also be invited to a 30-day free trial of the technology.
Don’t miss the opportunity to build your understanding on how to benefit from our new technology, as your window to the market.
Join us in this webinar as we look at shorter-term trading strategies for both long & short positions & we review how we utilise the Saxo Trader Go platform to take advantage of trading opportunities within the ASX top 50 stocks. We explore the features, how to place and manage orders and look at how short term traders can use the Investor Signals’ research to trade both long and short signals using CFD’s.
Don’t miss the opportunity to learn how we apply proven techniques to shorter term trading on ASX 50 CFD’s.
US Stock indexes may have dodged a bullet today when President Trump defied his White House advisors and sided with Democrats to defer the debt ceiling debate until December.
Using the legal structure of a “continued resolution” linked to emergency aid to victims of hurricane Harvey, the proposal would suspend the borrowing cap, currently at $19.9 trillion, until December 15th.
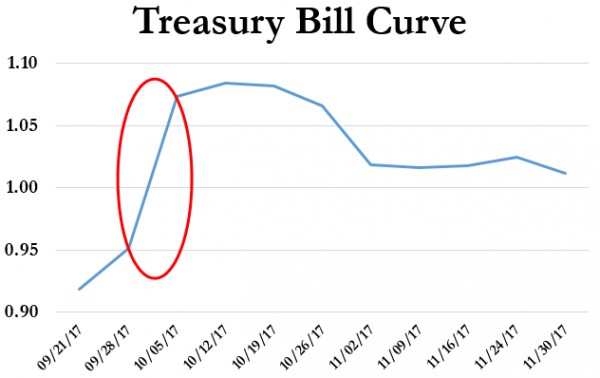
And while this manoeuvre calmed the nerves of T-Bill investors into the October maturity, the fear premium of a government shutdown has just been transferred to the December maturity.
Over the next few days we expect to hear more about how this political tactic will impact the administration’s legislative goals on tax reform, infrastructure programs and border security.
The prime risk to US equity markets is that credit agencies view this failure to address the debt ceiling as cause to downgrade US Sovereign debt ratings.
In short, “kicking the can” down the road has not made US assets less risky at current levels.
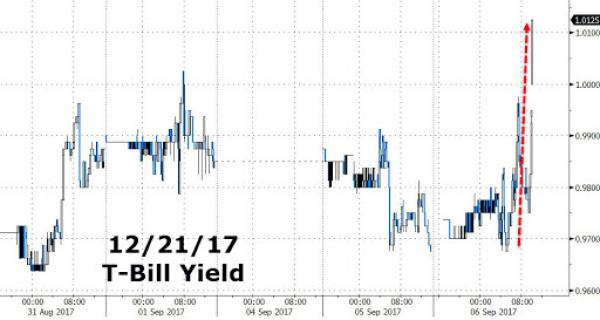 December T-Bill Yields
Up until last week, US Stocks had spent the last five months gradually moving higher, without many big daily gains or losses.
They had drawn strength from rising U.S. corporate profits and continued growth in the economy, along with recoveries in Europe and other EM regions.
It’s clear that investors still believe that if the global economy or equity markets ran into serious trouble, G-7 central banks would step in to help, just as they did after the 2008-09 global financial crisis.
Given the historically low volatility measures in the markets, it’s not surprising that on August 7th, a small 52 point rally (essentially all from Apple Inc) brought the Dow Jones 30 Index to its newest milestone of 22,062.
But this new record high belies the growing unevenness of the index.
Shares of Boeing, McDonald’s and health insurer United Health have contributed more than 700 points of the 1,000 points the Dow has gained since March 1, when the index topped 21,000 points for the first time.
This means that 10% of the components of the Dow index have been responsible for 70% of the overall gains over the last five months.
Meanwhile, Goldman Sachs and IBM, which helped lead the Dow’s surge in late 2016 and early 2017, have come crashing back to earth and are currently the worst performers in the Dow index this year.
A 1,000-point rally in the Dow 30 isn’t what is used to be a few years ago. As the index trades higher, each round-number milestone represents a smaller percentage move.
When the Dow advanced from 10,000 points to 11,000 points in early 1999, it was a 10% rally. By contrast, the move from 21,000 to 22,000 translates to a gain of just 4.8%.
The Dow index is more than 120 years old, and experts and market-watchers constantly debate how accurately it represents the overall health of the market. With only 30 companies in the index, the Dow reflects much less of the broad economy than the Standard & Poor’s 500 index, the NASDAQ or the Russell 2000, which institutional investors pay more attention to.
From a technical perspective, Dow points are also based on the individual stock price instead of the relative value of the company.
So a 1% move for an expensive stock like Boeing or Goldman Sachs, both priced well above $200 per share, will move the Dow Index more than Microsoft, worth around $70 per share, even though Microsoft has a capitalization of more than $550 billion compared to about $90 billion for Goldman Sachs.
This type of internal price dispersion is not limited to the narrow Dow 30 Index. Internal price dispersion has now become apparent in the SP 500 Index, which, as a much broader index, has much more significant ramifications for future share price valuations.
For example, a growing proportion of individual stocks in the SP 500 are now priced below their respective 200-day moving averages, with just a handful of names carrying the index higher over the last few months.
This widening divergence in leadership, (as measured by the proportion of individual stocks hitting new highs versus new lows), is not a bullish indicator for US stocks going forward.
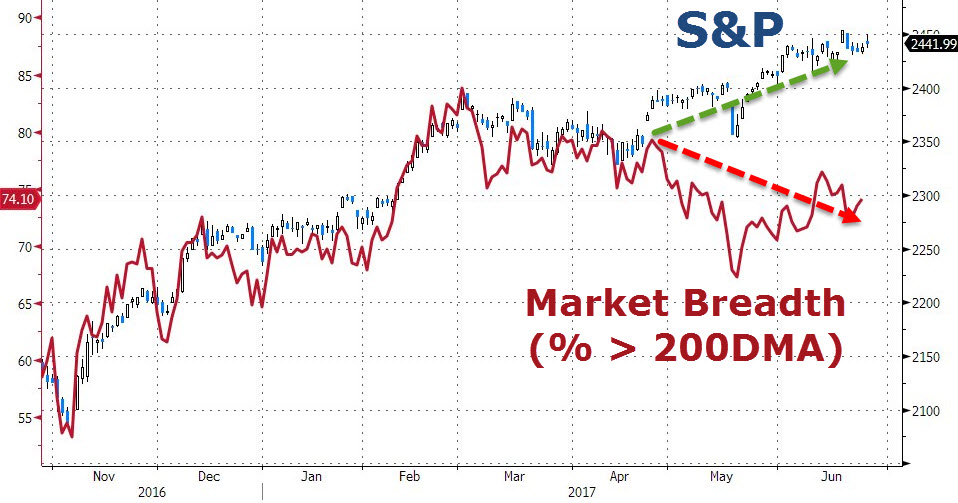
The chart below illustrates the percentage of U.S. stocks above their respective 200-day moving averages, compared with the S&P 500 Index. The deterioration and widening dispersion in market internals is no longer subtle and points to price momentum turning lower.
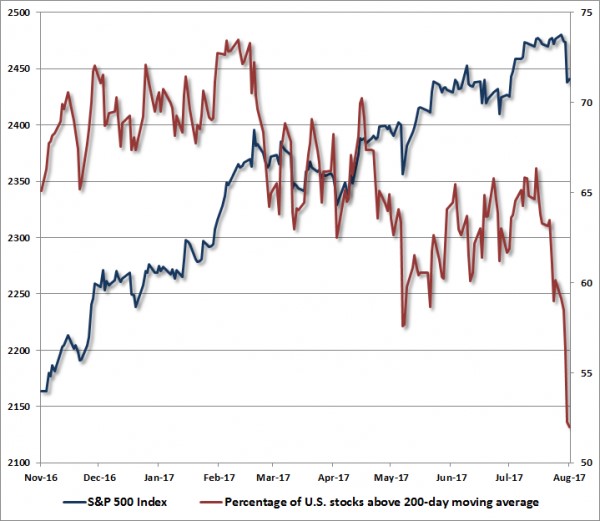
Further, this degree of dispersion suggests that not only is risk-aversion rising, it is also picking up pace.
Across history, this sort of shift in individual share prices, coupled with extreme overvalued P/E’s and over-bullish sentiment, has been the hallmark of major price peaks and subsequent market corrections.
Looking across the financial landscape, we see several other potential triggering events which could signal a material correction in global equity markets. Of these potential market inflection points, five stand out as troubling and worth noting.
Within this list, the most severe market event would be the failure of the US Congress to raise the debt ceiling in time to prevent a shutdown of the US Government: this event caused 16% drop in the US SP 500 in 2011, as referenced in our August 14th blog report titled “Black Monday 2011, revisited.”
On August 1st, the US Treasury Department announced that the debt ceiling, (the statutory limit of outstanding debt obligations that the federal government can hold), must be raised by September 29th. After lawmakers return from their summer break, that will give Congress 12 working days to pass legislation to get to President Donald Trump’s desk.
If this deadline is breached, it could lead to disastrous consequences for the Federal government, the US economy, and the global financial system. If the debt ceiling is not raised, the US government would lose the ability to pay bills it already owes in the form of US Treasury bills and could lead the US to default on some of that debt.
The possible fallout from a default, according to a recent study by the Treasury Department, would include a meltdown in the stock and bond markets, a downgrade of the US’s credit rating and the undermining of the full faith and credit of the country.
It’s our base case that despite the potentially dire consequences, there is some confidence but no guarantee that factions in Congress, with a variety of competing interests, will be able to come together on a deal to raise the limit.
And even though the US Government has raised the debt ceiling 78 times over the last 57 years, the political uncertainty in Washington is making investors realize that the chances of successfully negotiating the debt ceiling legislation without a Government shutdown are dwindling.
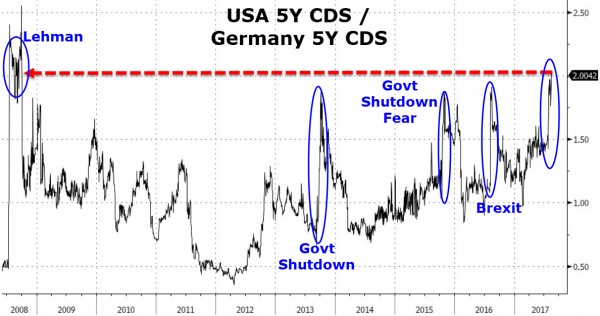
Institutional investors in the US Credit markets have already started pricing in a Government financial disruption as illustrated in the spike in US credit default risk and the inversion in the US T-Bill curve.
Unfortunately, based on recent negotiations for Health Care and Tax reforms, the Congress has not proven that it’s lawmakers are motivated to do what’s best for the American people, or that it can get anything done.
What’s more, the debt ceiling debate is likely to become ultra-politicized with special interest spending provisions attached to the final legislation.
This confluence of internal share price dispersion, combined with the backing up of risk aversion in the short-term credit markets, alerts us to a market condition which could lead to profound disappointment for investors.
All of our key metrics of expected market risk/return prospects are unfavorable at current market levels.
Some market commentators have projected that the SP 500 will complete the current re-pricing cycle at an index level up to 60% lower, or in the low 1000 handle. Our research doesn’t point to a level that low, but we do believe the market has scope for a 20% correction over the next three months.
As such, we strongly urge our clients and subscribers to examine all of your investment exposures, and ensure that they are consistent with your actual investment horizon and tolerance for risk.
As the SP 500 continues to trade near all-time highs, market analysts are reviewing various metrics to determine whether US Stock prices have more upside, or if they are ready for a downside correction.
One of these metrics is “Market Breadth.” Market breadth is a technique used to gauge the direction of the market by measuring the number of stocks trading higher versus the number of stocks moving lower
“Positive” breadth occurs when more stocks are moving higher than lower and vice versa for “negative” breadth.
The breadth numbers are used to determine whether the market has positive momentum or negative momentum.
The chart below shows that the SP 500 and market breadth have been diverging since late-April.
To put this divergence into perspective, as of last Friday, nearly 40% of SP 500 stocks were trading below their 200-day moving averages. In addition, 6% of the stocks listed on the NYSE hit new 52-week lows last week.
We will watch these measures closely to see if the current market pricing is resolved to the upside, or if the US Indexes commence a correction lower.
SP 500 vs Market Breadth
Level 17 Chifley Tower
2 Chifley Square
Sydney, NSW 2000
1300 614 002
Investor Signals Pty Ltd
ABN 44 143 555 453