ASX 200 Trade Table: RMS +38%
RMS:ASX is up 38% after a 33-day holding period.
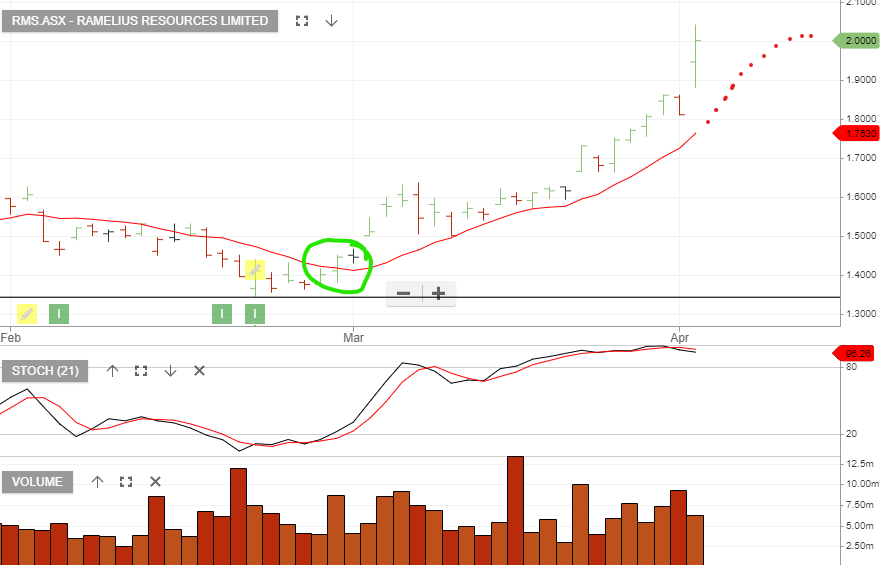
RMS:ASX is up 38% after a 33-day holding period.
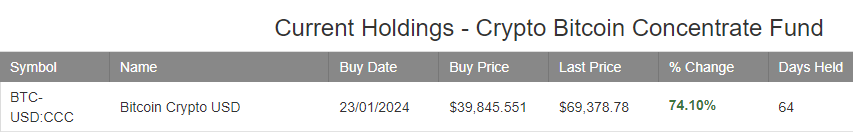
Bitcoin is up 74% after a 64-day holding period.
The bullish outlook is supported by…
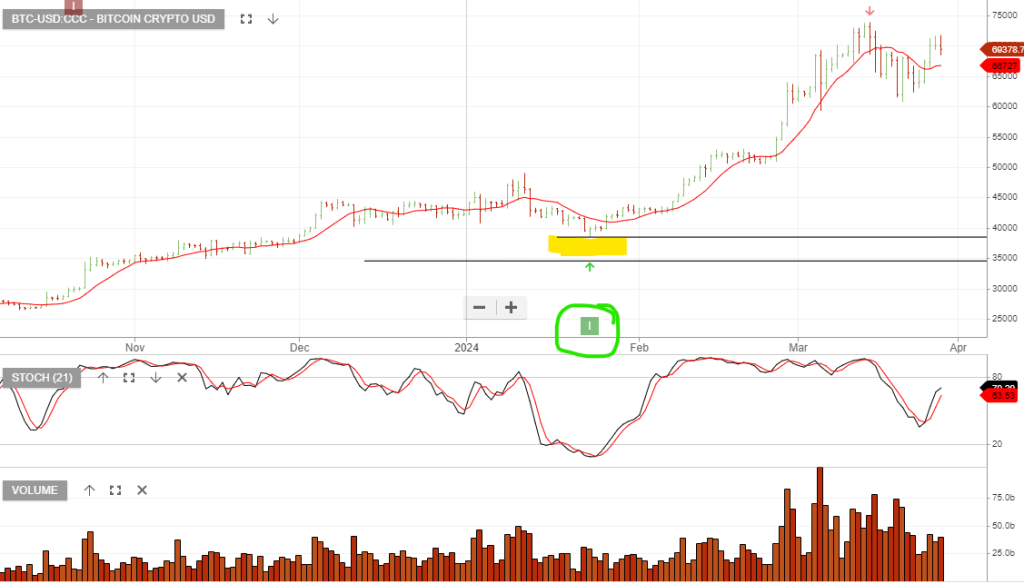
2024 S&P 500 earnings per share will hit $250, and 2025 EPS will be at $275. A virtuous cycle forming from AI investments will see hyper scalers Microsoft, Amazon, Alphabet, and Meta spend $US180 billion on capex in 2024E, +27% YoY.
The $US38 billion YoY increase in capex represents about 80% of their expected earnings growth YoY.
Semis and networking are the most obvious beneficiaries, but increased power usage and the physical build-out of data centres will lead to more demand for electrification, utilities, commodities, etc. Productivity gains from AI and domestic investments will also provide a significant tailwind.
As big tech enters an investment cycle and the old economy cuts costs/capex, the growth differentials merge between tech and the others to propel the S&P500 much higher.
On the other hand, the bears suggest…
Every technological revolution like this—from the internet to telephones, railroads, or canals—has been accompanied by massive hype and a stock market bubble as investors focus on the technology’s ultimate possibilities, immediately pricing most of its very long-term potential into the current market prices.
Many such revolutions are, in the end, often as transformative as those early investors could see and sometimes even more so – but only after a substantial period of disappointment during which the initial bubble bursts. Thus, as the most remarkable example of the tech bubble, Amazon led the speculative market, rising 21 times from the beginning of 1998 to its 1999 peak, only to decline by an almost inconceivable 92 percent from 2000 to 2002 before inheriting half the retail world!
Are there parallels with the current AI bubble?
Join our Investor Club for a 14-day free trial and access next Monday’s 30-minute live webinar, during which I’ll outline the must-have market playbook.
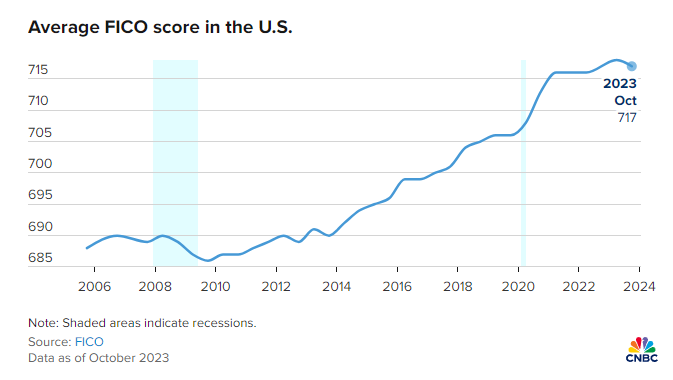
FICO credit scores have steadily improved for a decade, but increases in missed borrower payments and rising consumer debt levels are starting to take a toll.
The national average credit score, which has steadily increased over the last decade, fell to 717 from a high of 718 in the beginning of 2023, according to a report from FICO, developer of one of the scores most widely used by lenders. FICO scores range between 300 and 850.
A good score is generally above 670, an excellent score is over 740, and anything above 800 is considered exceptional.
The downturn in FICO scores requires ongoing monitoring.
Join our Investor Club for a 14-day free trial and access next Monday’s 30-minute live webinar, during which I’ll outline the must-have market playbook.
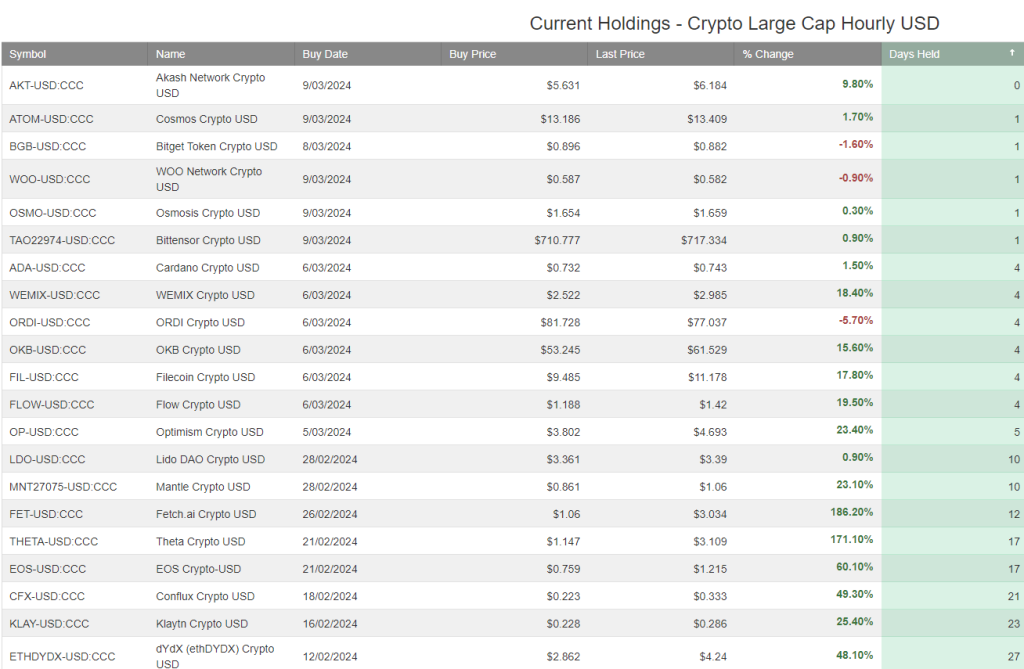
Our crypto algo engine has generated a 740% return since October 2023. The automated trading model focuses on large-cap momentum.
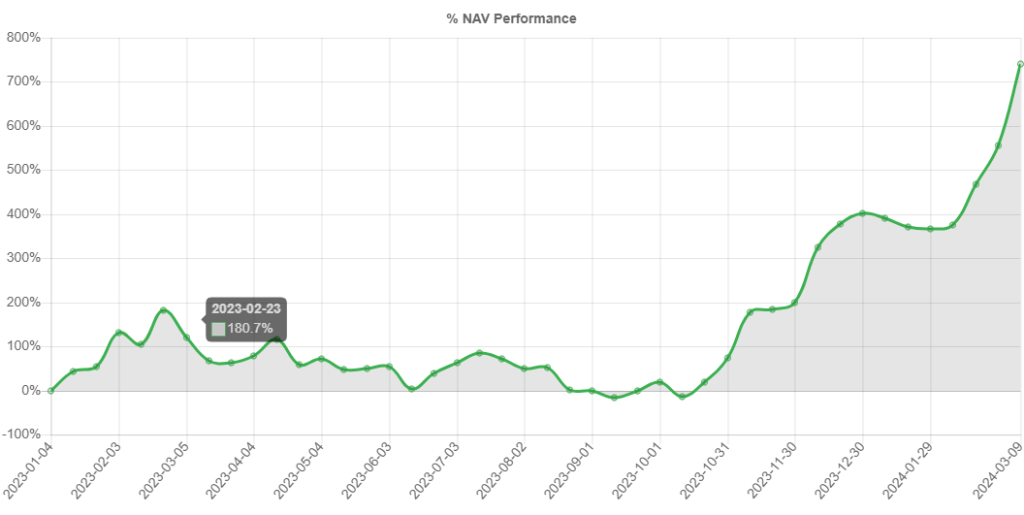
Recent portfolio additions include;
For all enquiries, please call 1300 614 002.
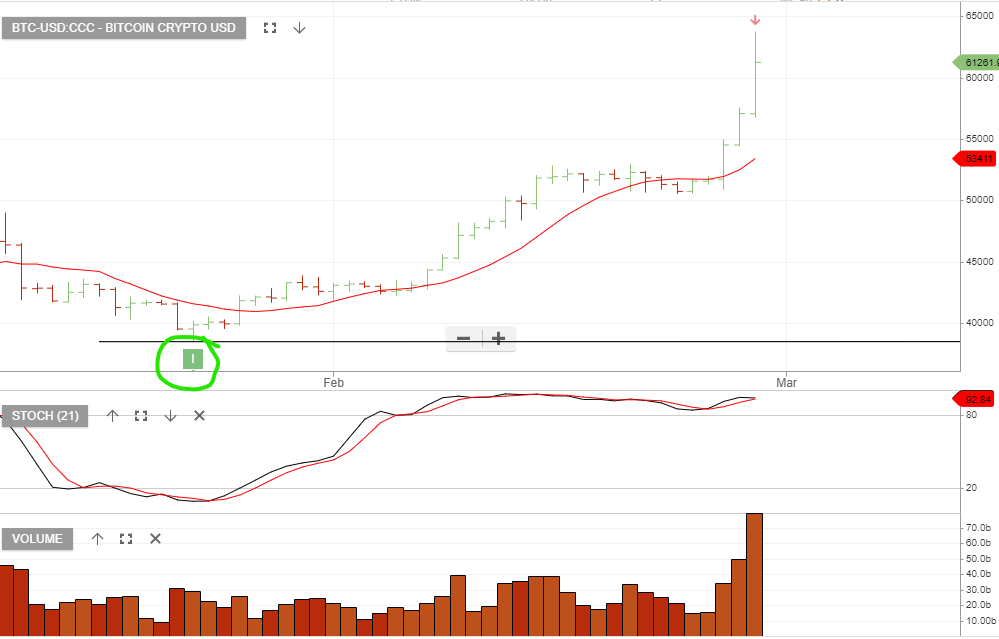
Bitcoin surpassed its November 2021 record high on Tuesday as demand for the token continued to be filed by excitement over spot bitcoin ETFs and the April halving event. Our Algo Engine generated a buy signal in January and the holding is up 71% after 47 days.
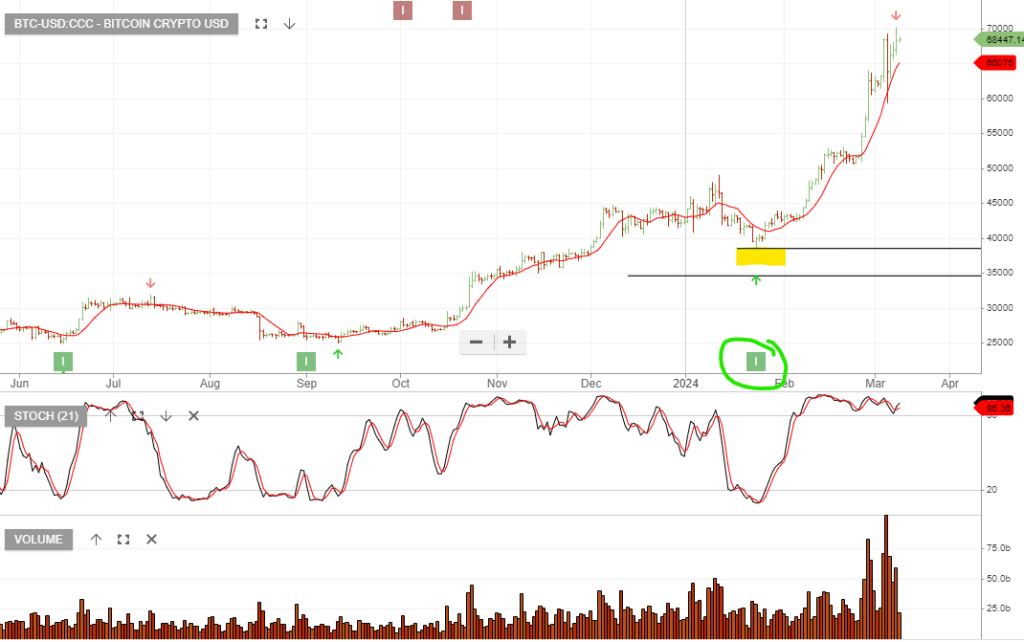
The red arrow suggests we’re nearing a short-term peak and traders may look at hedging any long exosure on a downturn in the price momentum.

Our Algo Engine generated a buy signal in Bitcoin on 23/1/2024, and the trade is up 53% after 36 days.

In case you missed it, you can watch last night’s webinar here.
At the start of 2023, we added 5 ETFs to the Investor Signals Global Growth portfolio. For the 12 months, the portfolio returned 80% with the bulk of the gains attributed to Cyber Security, Cloud Computing, and Fang.
We will be building the tracking portfolio of our favored funds for 2024 and covering these in our next public webinar.

In case you missed it, you can watch last night’s webinar here.
Level 17 Chifley Tower
2 Chifley Square
Sydney, NSW 2000
1300 614 002
Investor Signals Pty Ltd
ABN 44 143 555 453