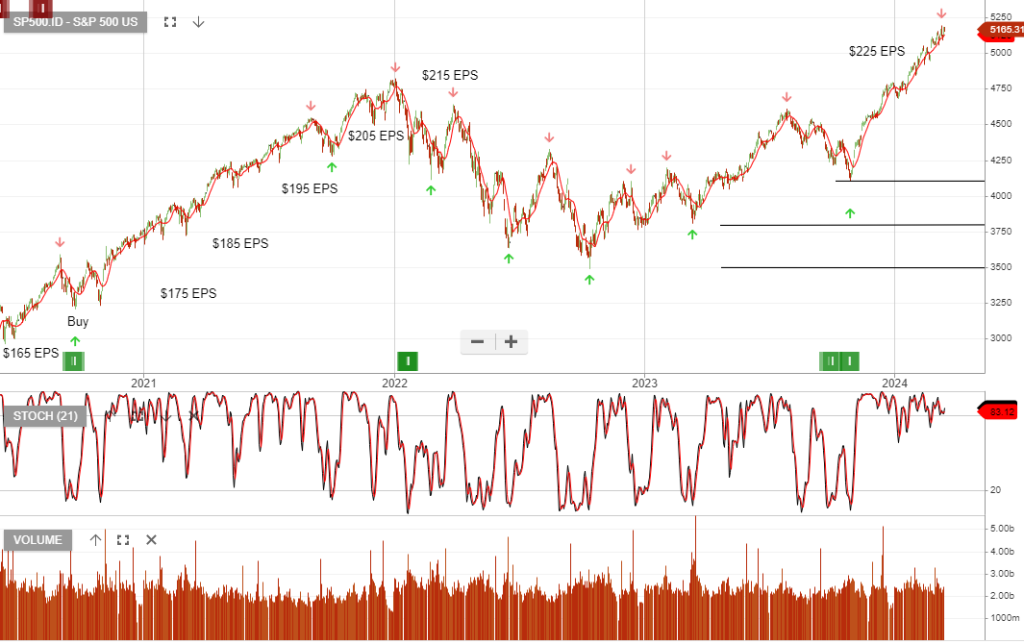
The bullish outlook is supported by…
2024 S&P 500 earnings per share will hit $250, and 2025 EPS will be at $275. A virtuous cycle forming from AI investments will see hyper scalers Microsoft, Amazon, Alphabet, and Meta spend $US180 billion on capex in 2024E, +27% YoY.
The $US38 billion YoY increase in capex represents about 80% of their expected earnings growth YoY.
Semis and networking are the most obvious beneficiaries, but increased power usage and the physical build-out of data centres will lead to more demand for electrification, utilities, commodities, etc. Productivity gains from AI and domestic investments will also provide a significant tailwind.
As big tech enters an investment cycle and the old economy cuts costs/capex, the growth differentials merge between tech and the others to propel the S&P500 much higher.
On the other hand, the bears suggest…
Every technological revolution like this—from the internet to telephones, railroads, or canals—has been accompanied by massive hype and a stock market bubble as investors focus on the technology’s ultimate possibilities, immediately pricing most of its very long-term potential into the current market prices.
Many such revolutions are, in the end, often as transformative as those early investors could see and sometimes even more so – but only after a substantial period of disappointment during which the initial bubble bursts. Thus, as the most remarkable example of the tech bubble, Amazon led the speculative market, rising 21 times from the beginning of 1998 to its 1999 peak, only to decline by an almost inconceivable 92 percent from 2000 to 2002 before inheriting half the retail world!
Are there parallels with the current AI bubble?
Join our Investor Club for a 14-day free trial and access next Monday’s 30-minute live webinar, during which I’ll outline the must-have market playbook.
alan@sniper.co.nz says:
Hi Leon
Can you please turn on the US charts for me – something you indicated that we just need to drop you an email for.
I am only tracking a few shares here but am interested in learning more about the US markets
.
Re selling positions:
is it best to wait for the red “Sell” mark by the system or make a calculated decision when a red arrow only appears? I notice the system red sell mark does not always follow a red arrow
Many thanks
Alan