XJO & Dow Jones – Chart Update
The XJO remains near recent resistance as more than 50% of top 200 companies have reported their earnings. Average reported revenue is up 3.4% on the same time last year and underlying average profits are up 6%.
The Dow Jones chart shows the index breaking to the upside of the recent 20,000 consolidation range.
We remain cautious of the extended share price valuations and moderate underlying earnings growth.
For this reason we continue to tilt client portfolio’s towards defensive assets. We prefer reducing exposure to resource and banking stocks across the next quarter and increasing exposure to healthcare and consumer staples.
Our tight covered call overlay is boosting cash flow to 10 – 12% per year.
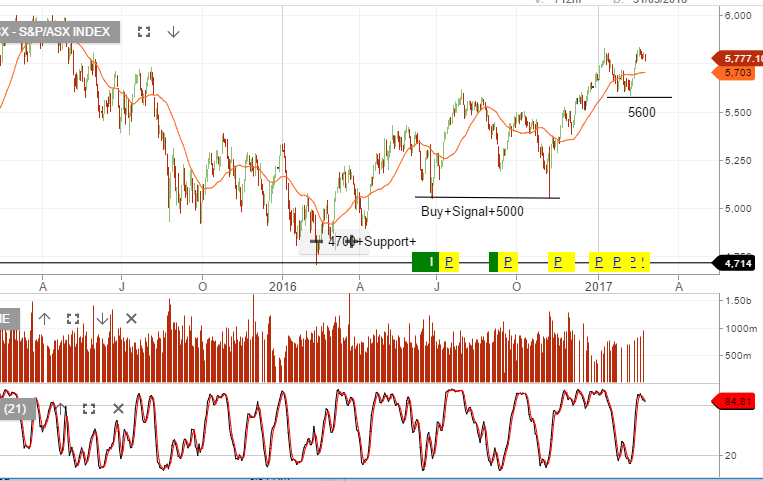
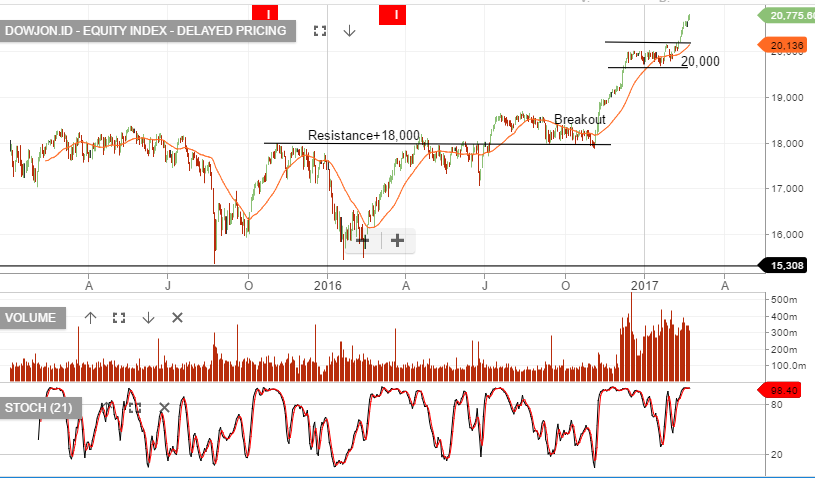
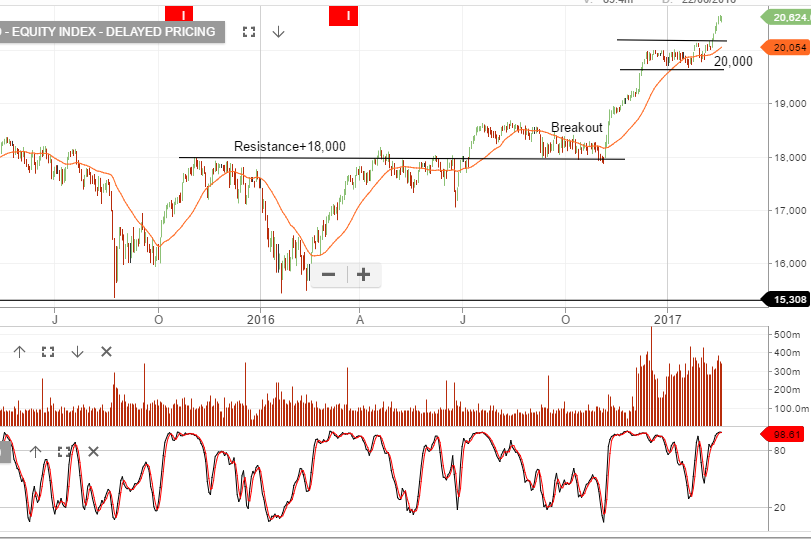
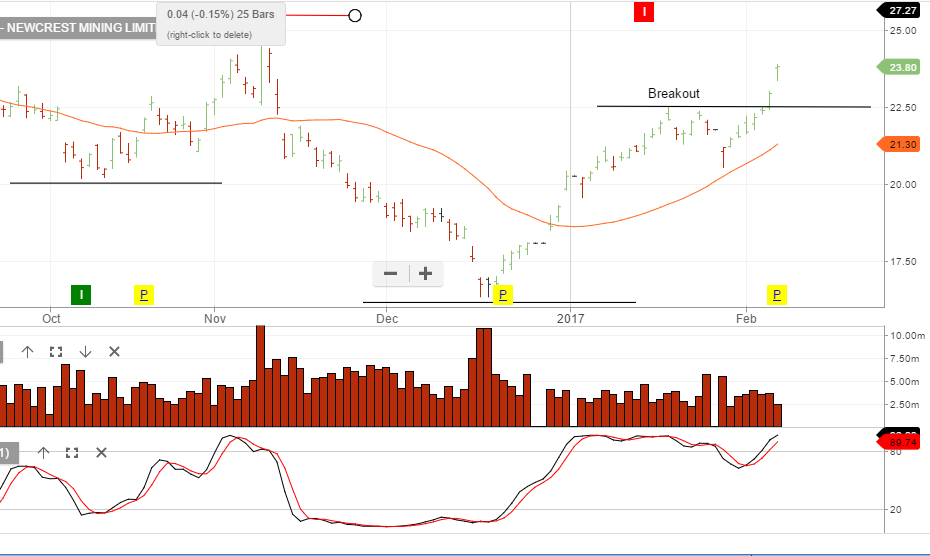
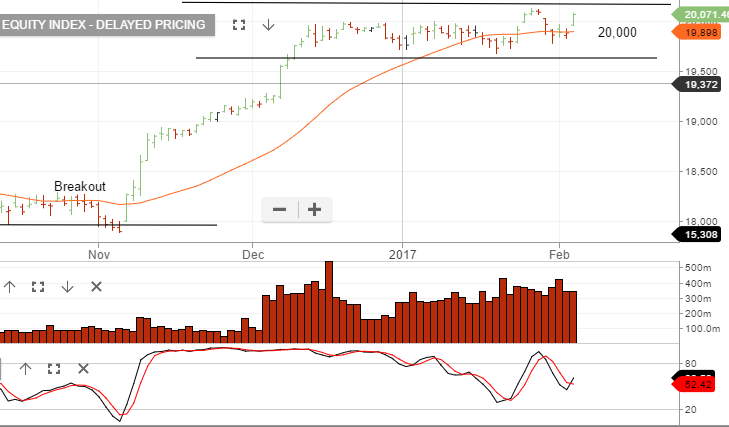
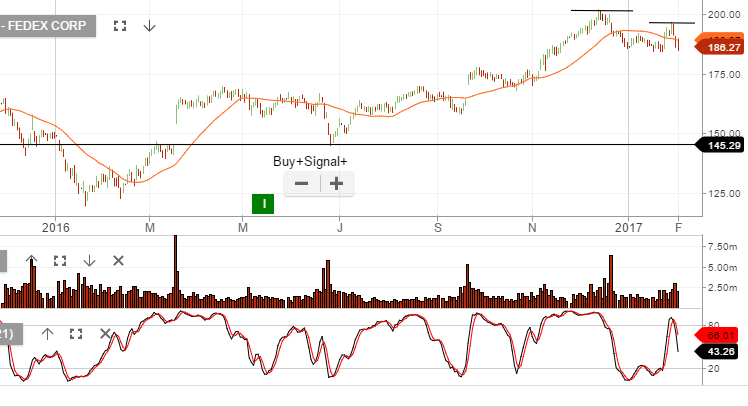 Chart – FedEx