A little more than three months ago the citizens of the UK voted to leave the European Union (EU). In the lead-up to the June 24th referendum, many economists predicted an immediate recession and economic chaos on a “Yes” vote.
This sentiment was echoed by then PM David Cameron who said a vote to leave the EU would cause an economic shock that would cost the nation at least 500,000 jobs. This warning, along with UK Treasury predictions of the longer-term damage “Brexit” would cause were the cornerstones to what Brexit supports called “project fear”.
Furthermore, many international institutions — including the Bank of England and the International Monetary Fund — also warned that leaving the EU would have dire economic costs.
However, after yesterday’s stronger-than-expected UK GDP report, project fear now seems like an abjectly partisan political tactic and an economic non-starter.
In fact, the first official growth figures since the Brexit have not only confounded the governments warnings of a recession, but given validation to the few economic pundits who predicted the UK would be better off outside of the EU.
The numbers weren’t stellar, but, according to the Office for National Statistics, the UK economy grew by 0.5% between July and September. The UK Treasury had predicted it would shrink by 0.1%.
And while it’s clear that the Bank of England won’t be removing stimulus anytime soon, it appears that the fundamentals of the UK economy are strong and the GDP data show that the economy is resilient. The internal data in the report reflected an expansion at a rate broadly similar to that seen since 2015 and there’s really little evidence of a pronounced negative effect in the immediate aftermath of the Brexit decision.
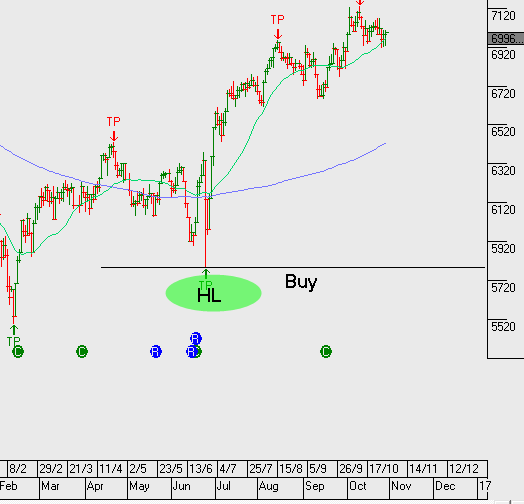
This nascent sense of stability and cautious optimism is best illustrated in the UK Treasury curve. Since bottoming out at .530% in mid-August, the 10-year Gilt yields have more than doubled and have now traded at a six-month high at 1.285% after the GDP data. In addition, over the same period of time, the FTSE 100 index has climbed over 4% from 6750.00 to close to 7,000.00
The question now is: when will the higher UK rates, firmer stock market and stable economic data translate into a stronger Sterling?
In our view, the answer is very soon.
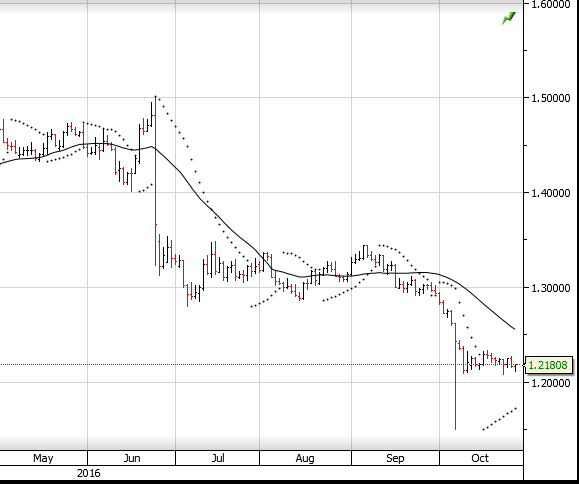
Looking at the daily GBP/USD chart, it’s clear that the “flash crash” on October 7th is still the most dominate technical feature. However, with the market positioning leaning very heavy to the short side, and very little swap benefit in holding short Sterling without downside price momentum, it’s reasonable to expect the risk of a short squeeze is increasing.

