June Quarter US Market Update – Video
The Dow Jones index continues to hold the higher low technical formation.
We review which stocks within the Dow Jones top 30 index are presenting relative strength, supported by our Algo Buy signals.
The Dow Jones index continues to hold the higher low technical formation.
We review which stocks within the Dow Jones top 30 index are presenting relative strength, supported by our Algo Buy signals.
The US unemployment rate unexpectedly fell to 4.3%, a new multi-year low, but it is a misleading statistic for what was a very disappointing overall report.
Besides the decline in the unemployment rate, and a further decline in the under-employment rate (U-6) from 8.6% to 8.4%, there is little positive in today’s report.
Non-farm payroll growth fell to 138k, nearly 50k below expectations, which had been bolstered by the weekly jobs claims and the ISM jobs component. Adding insult to injury, the back to months saw jobs growth revised 66k lower than first reported.
Moreover, the drop in the unemployment rate can largely be explained by the decline in the participation rate from 62.9% to 62.7%. This unwinds this year’s improvement in the participation rate, and bring it back to where it finished last year.
It’s time to take profit or sell tight covered calls in the following names:
Resmed, Treasury Wines, Transurban, Sydney Airports, Caltex, Ansel, Sonic Healthcare, CIMIC Group, Amcor, Brambels & Medibank.
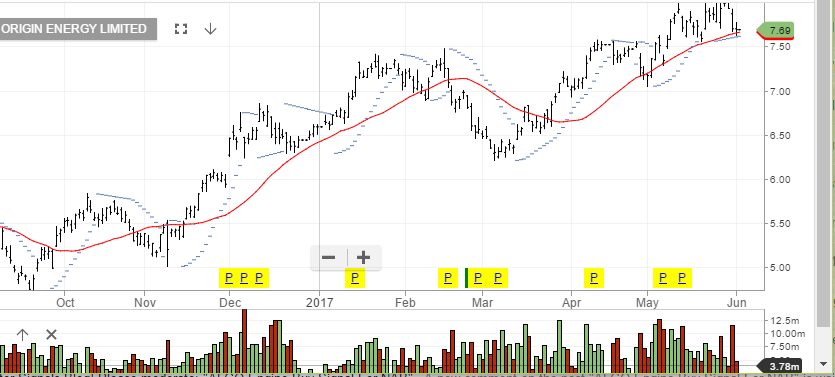
Origin Energy has been trading in a broad range between $6.70 and $8.10 over the last four months.
We recently took profits for client portfolios at $8.00 and are currently looking for a retracement into the $7.50 area to re-enter long positions.
The recent weakness in crude oil has had a dampening effect on various energy names. However, we feel Origin’s natural gas assets will keep the share price fairly well bid over the medium to longer-term.
Origin
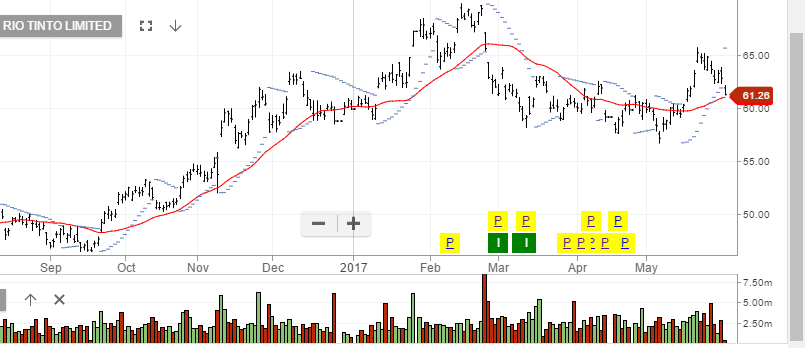
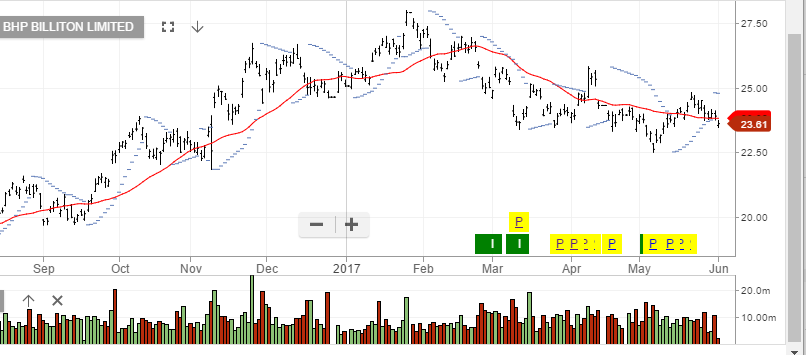
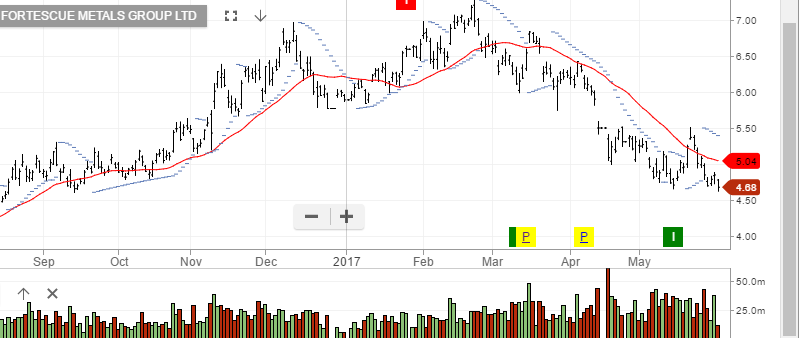
Spot prices of Iron Ore fell again overnight dropping to a fresh seven-month low. The 62% grade was down over 2.5% to close at $57.02 per ton.
During the month of May, Iron Ore dropped over 17%, extending its decline from the multi-year high of $95.00 last traded in February.
Mining names BHP, RIO and FMG are all under pressure in early trade losing more than 1% each.
FMG has reached an eight-month low of $4.70. We see the next downside targets on Rio and BHP at $59.50 and $22.50, respectfully.
 Rio Tinto
 BHP
BHP
Fortescue Metals
Regular readers of the blog will recall the Goldman Sachs post we made on the 19th May 2017, (the post referenced the downward channel GS was tracking).
In the last few trading sessions, the stock rallied to the resistance within the channel and has now moved sharply lower in overnight trade.
Goldman Sachs was down 3.3% and was the worst performing Dow Jones stock in the overnight session. As the US reflation trade loses momentum, the bounce in the US financials has met renewed selling pressure at “lower high” levels.
The chart below shows Goldman Sachs’ sharp reversal.


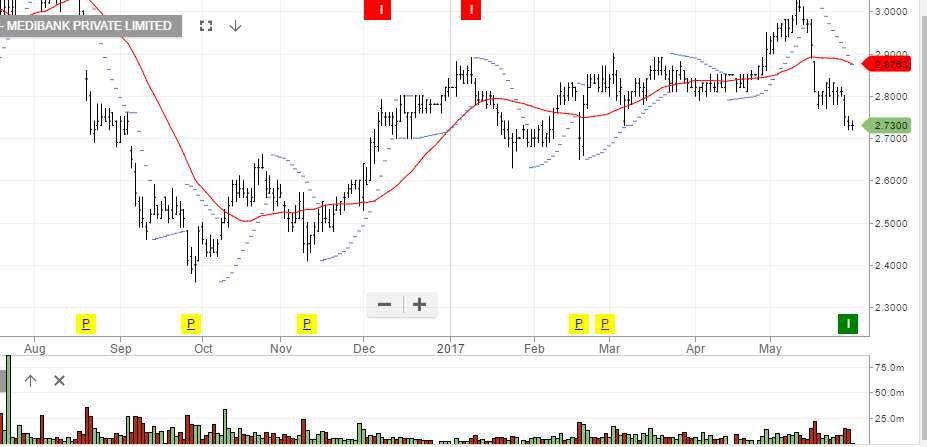
The ALGO engine triggered a buy signal on yesterday’s close for MPL at $2.72.
Internal momentum indicators are showing an oversold condition, which doesn’t rule out a test of the January lows near $2.60.
As a defensive name in an increasingly uncertain market, we suggest buying shares of MPL and using a derivative overlay strategy to enhance the returns.
We still see limited revenue growth and material resistance in the $3.00 area. However, with the 4% dividend yield and income from the option premium, we see the stock as positive income contributor to client portfolios.
Medibank
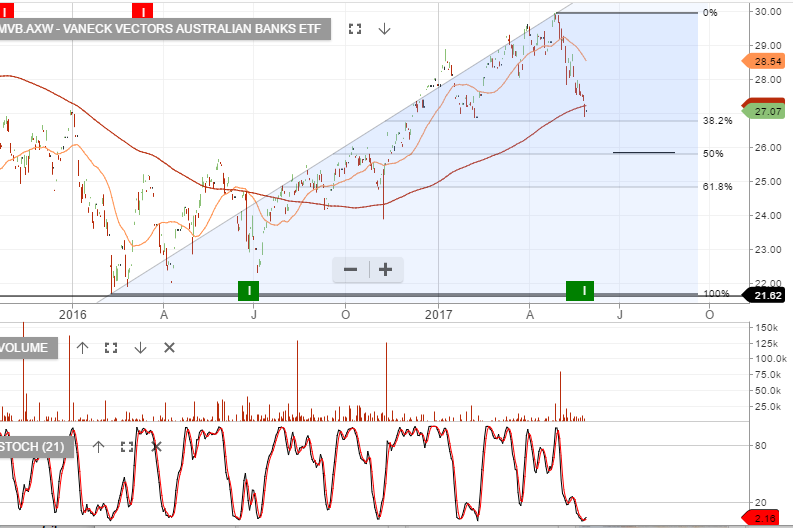
We’ve been net sellers of the banks and we continue to remain cautious. The probability of discounted rights issues, increasing bad debts, reduction of dividends and little or no revenue growth, hardly makes for a compelling investment case.
However, the chance of the washout being completed in one continued move lower, is low. Normally, we’d expect to see value investors step in at some point and create a more structured decline, with reasonable rallies within the broader downtrend.
With the above in mind, I’ve looked at the MVB Bank ETF and based on a 50% retracement, we’re now within 5% of the likely support area. Any bounce will be moderate and investors should again look to sell the rally.
Our Algo Engine will continue tracking the entry signals.
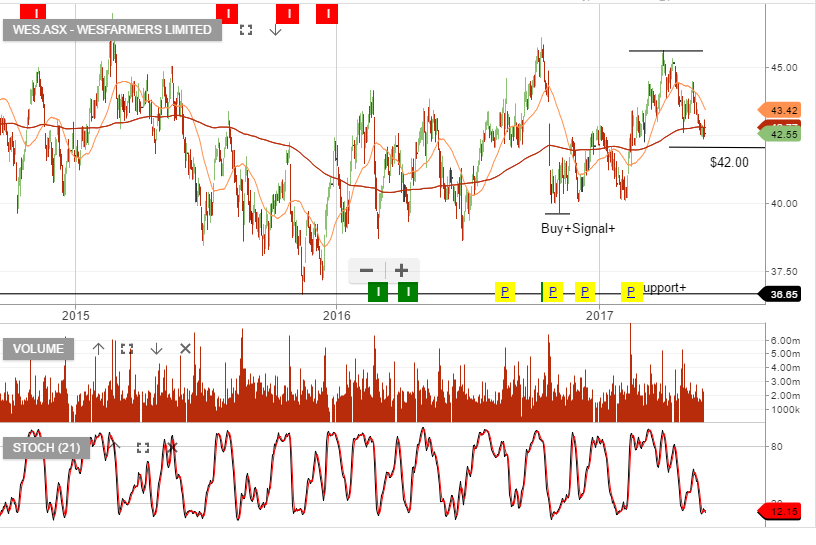
Wesfarmers will be providing a strategy briefing day on the 7th of June, it’s possible commentary from the presentation will add buy-side support to the stock price.
Our FY18 forecast revenue is $72b, EBIT $4.8b, EPS $2.82 & DPS $2.44, placing the stock on a forward yield of 5.7%.
Over the past 3 years any pullback in the share price to the $40- $42 range has provided a good entry level. Resistance or selling has occurred at or near $45.
After posting a low on May 9th at $1215.00, Gold touched a high $1270.00 in late NY trade on Friday. Internal momentum indicators are looking constructive for a move back to the April high of $1295.00
For investors looking to profit from a higher gold price, we suggest buying shares of NCM, EVN, or the BetaShare Gold ETF with the symbol: QUA.
We have a medium-term target for NCM at $25.50, $3.00 for EVN and $14.00 for QUA. 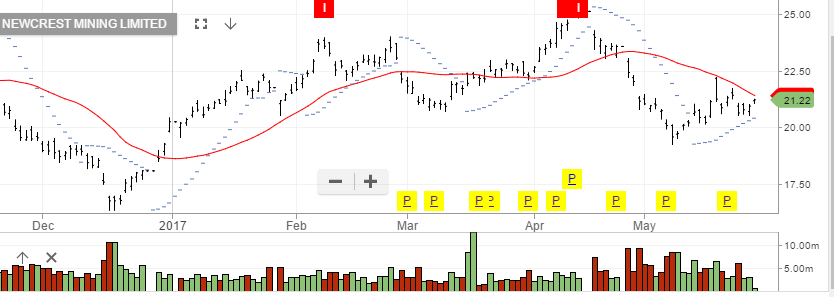 Newcrest Mining
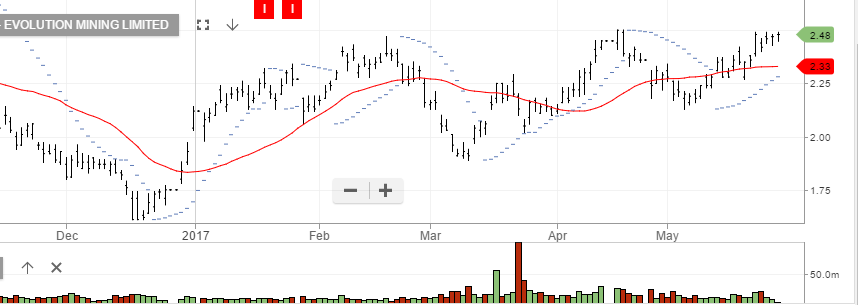
Evolution Mining
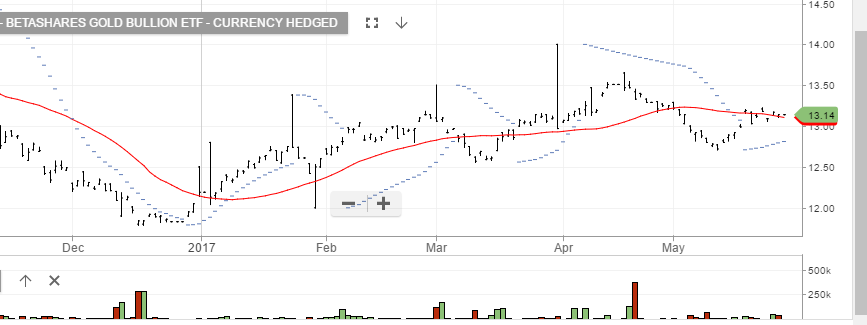
BetaShare Gold ETF
Level 17 Chifley Tower
2 Chifley Square
Sydney, NSW 2000
1300 614 002
Investor Signals Pty Ltd
ABN 44 143 555 453