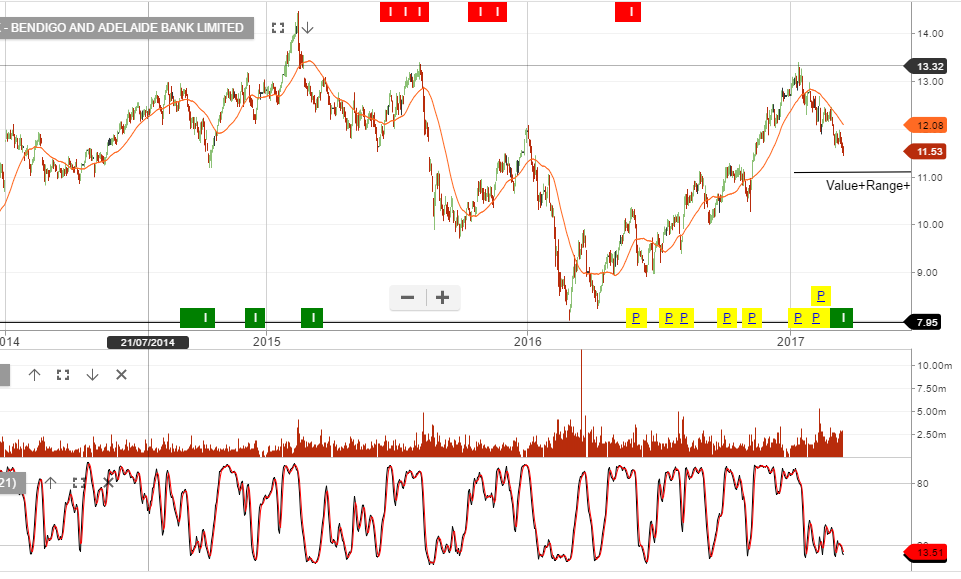
Our Algo Engine is flagging BEN with a technical buy signal.
We’re mindful of the downward pressure on the banking sector following today’s weak employment data.
Therefore, we’re not buyers at present, but we’ll be watching BEN and looking for the short term indicators to turn positive at or near the $11.00 support level.
The US Federal Reserve raised the benchmark Fed Funds rate by 25 basis points to a range of .75% to 1%.
The FED’s “Dot Plot” Table of FED members’ projections for short-term interest rates showed three hikes in 2017, three in 2018 and three in 2019, which is unchanged from the prior forecast in December.
While the rate adjustment was expected, the unchanged forward guidance in the dot plots fell short of the street’s expectations. Many analysts’ were looking for a higher rate trajectory into the middle of 2018.
One reason given for the cautious outlook was the sharp fall in GDP growth for Q1 2017.
The Atlanta FED GDPNow tracker has been revised down to .9% from 1.9% in December.
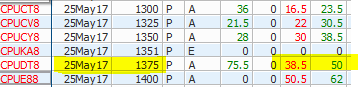
We generally don’t participate on the buy-side when it comes to options on individual stocks. However, we do buy index options to hedge portfolios or to make profits on short-term corrections.
In the current environment, when some stocks look overvalued, it makes sense to buy put options on a stock specific basis.
Let’s track these over the weeks ahead as a strategy to profit from a pull-back in the share price of CPU.
The Chinese government suggests there’ll be no hard landing. China’s financial system is generally stable and there are no systemic risks. Adding, that the government has enough policy tools to handle any risks.
China’s fiscal revenue and expenditure saw faster growth in the first two months of 2017, driven by an improved economy and higher spending on social welfare, official data showed yesterday.
Fiscal revenue rose 14.9% Y/Y to 3.15 trillion yuan (US$456 billion) in January and February, accelerating from 4.5% in 2016, according to data from the Ministry of Finance.
The ministry attributed the revenue pickup to positive trends in the Chinese economy, citing improvement in industrial activity, company profits, foreign trade and resident consumption.
The government is increasing policies to curb property price inflation within major cities and stem broader capital outflows from the Chinese economy. We continue to see these two issues as risks that may yet be underappreciated by the markets.
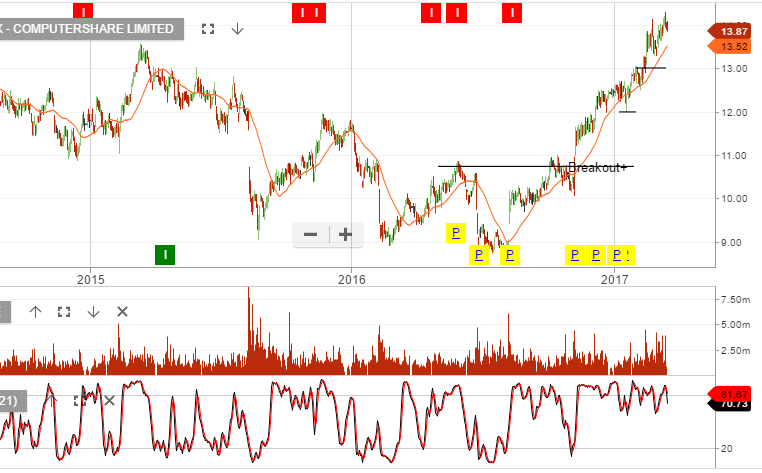
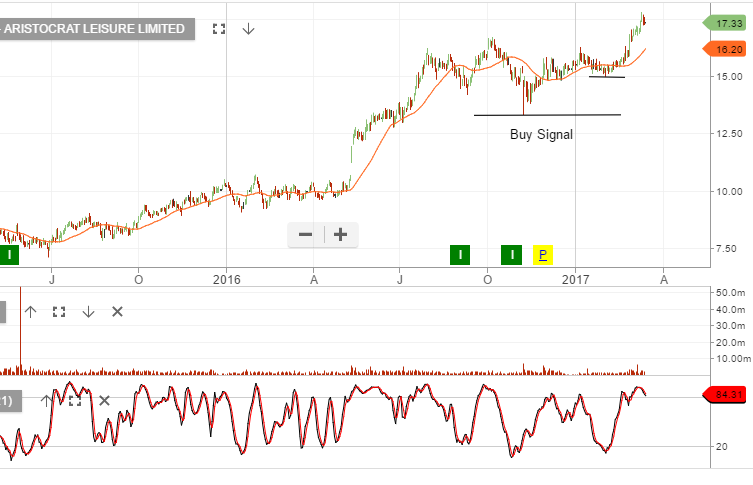
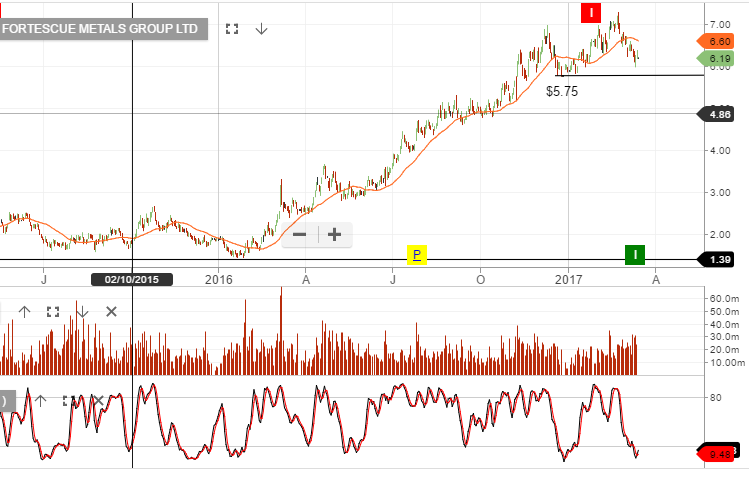
Since posting multi-year highs in mid-January, share prices for resource giants BHP and RIO have pulled back over 10%.
Over the last week, both shares have traded in a “higher low” pattern which has triggered a buy signal from our proprietary Algo engine.
With general market pricing appearing to be at, or near, full value, we are cautious about buying these names outright.
However, Investors looking to capture gains in the Australian resource sector without having to pick one stock can buy the BetaShare Resource Exchange Traded Fund (ETF).
The code is QRE, it’s made up of 10 Australian resource companies and is current paying a yield of 3.9%.
Of the 10 companies that make up the fund, BHP, RIO and WoodsidePetroleum make up 52% of the weighting.
Contact us for more information on QRE, or the other ASX-based ETFs we are currently following.
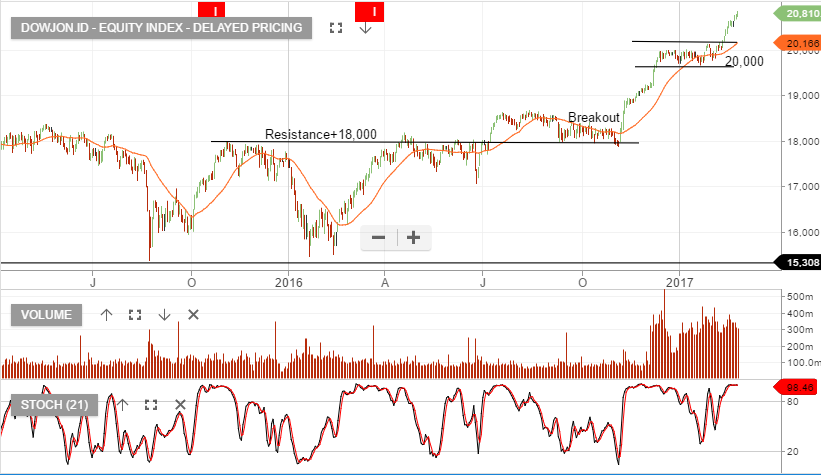
The US Federal Reserve will make their decision on interest rates this Thursday at 5 am, Sydney time.
An adjustment of 25 basis point to 1% for the Fed Funds target is now priced into the market.
As such, equity investors will be focused on the forward guidance about the pace and trajectory of US rates into 2018, and beyond.
This forward guidance will come in form of the FED’s “Dot Plots.” The dot plots are essentially a graphic reflection of where the FED members believe interest rates will be trading out until the year 2020.
For most equity investors, the key data will be how many rate hikes are expected to occur in 2017. When the FED raised the FED Funds target in December, the dot plots showed a consensus of three rates hikes during 2017.
The risk to the US equity market is that the FED dots plots are revised higher to include an additional rate hike for 2017.
If that’s the case, it’s reasonable to expect US stock indexes to trade lower, the USD to trade higher and US Treasury yields to continue to firm.
Since posting a high trade of .7740 on February 23rd, the AUD/USD has dropped over 250 points , or 3.2%.
A corrective bounce into the weekend sees the Aussie currently trading back near .7540, but the technical chart structure looks weak and momentum indicators are point lower.
In addition, The US Federal Reserve is a near certainty to raise the Fed Funds target this Wednesday.
This policy move will lift the Fed Funds target to 1%, and, (with Aussie overnight rates at 1.5%) will further narrow the overnight lending rate spread to just 50 basis points.
This fundamental shift will likely accelerate the repricing of the AUD/USD back into the .7300 handle.
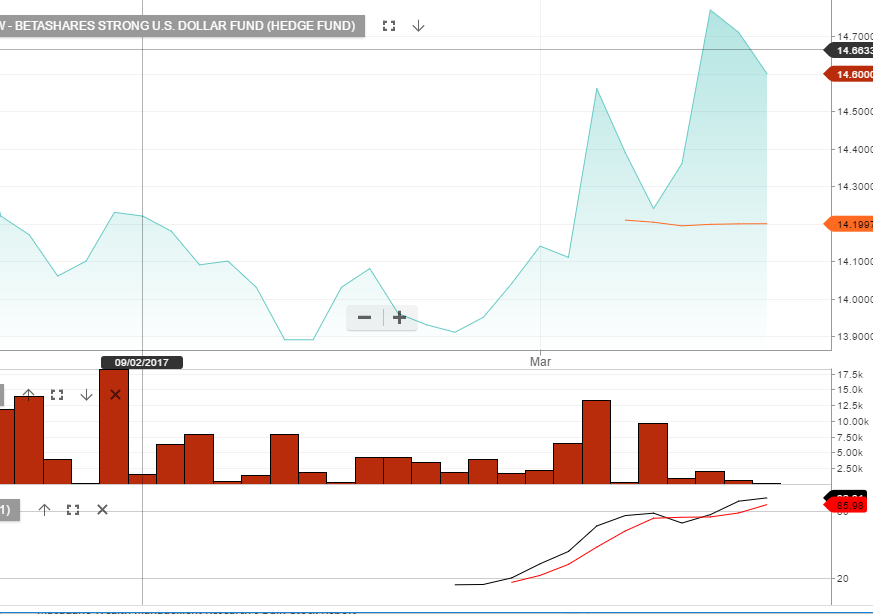
Investors can profit from the AUD/USD moving lower with the BetaShare YANK Exchange Traded Fund (ETF).
YANK is an inverse, unit trust EFT with a weighing of approximately 2.5 to 1. This means that a 1% drop in the AUD/USD price will increase the value of the ETF units by approximately 2.5%.
Chart – YANK
Sophisticated Investor?
We have special opportunities available for Sophisticated Investors. If you're interested, and qualify, please provide your details below.