A Yield Play For Telstra

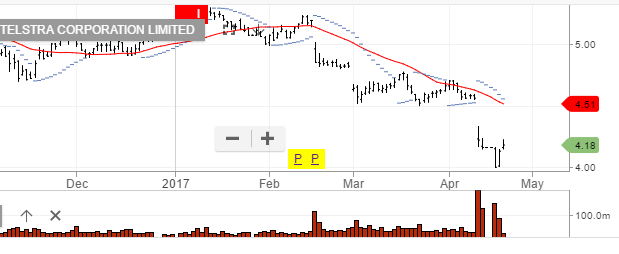
Shares of Telstra have dropped close to 15% over the last month. When the shares traded at $4.00 on Tuesday, this was the lowest price since October 2012.

While some of the pricing fundamentals may be unclear going forward, from a pure yield perspective, we see the potential for value.

At current prices, if TLS matches it’s previous dividend of 15.5 cents in September, this puts the stock on a forward yield of over 8%; plus franking credits.

We consider this good value and like the long side of TLS for a move back over $4.50 in the medium-term.

 Telstra

Drop In Crude Oil Puts CTX back In The Buy Zone

WTI Crude Oil prices posted their largest one-day loss in six weeks, as the US Energy Information Administration reported a smaller than expected draw down on crude supplies.

The Spot crude price fell $1.97, or 3.8% to settle at a 4-week low of $52.90. The next level of support will be found at $52.50.

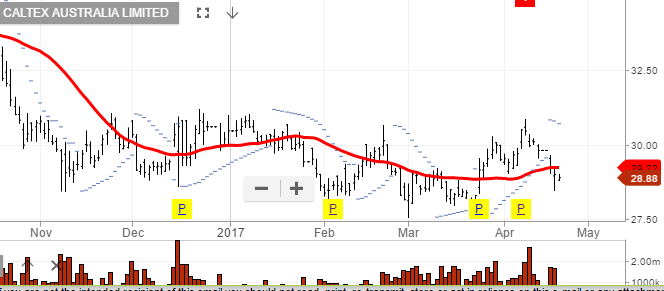
We expect the overnight fall to put shares of Caltex (CTX) back into the buy zone around the $28.80 level.

Regular readers will recall that we sold our long positions in CTX early last week in the $30.50 area.

The Daily chart pattern is showing a trading range of $28.30 to $30.50, we are looking to trade this range over the near-term.

Chart Caltex

BHP And RIO Trade Lower As Iron Ore Continues To Unravel

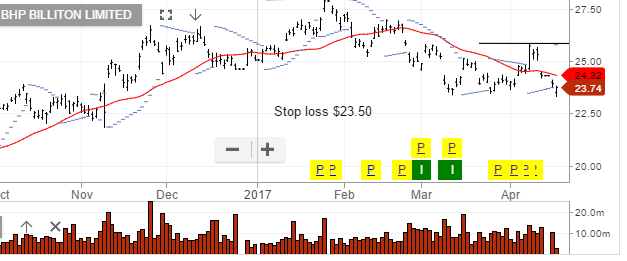
The Spot Iron Ore price continued to trade lower overnight, losing 4.6% to reach a 6-month low of $63.20 per dry tonne. This is a 33.5% drop from the high of $95.00 last traded on February 21st.

It’s worth noting that the sharp selloff is picking up pace just weeks away from the delivery of the Australian Federal Budget.

Since Iron Ore remains the country’s single biggest export, Federal revenue projections are highly sensitive to the outlook for Iron Ore prices.

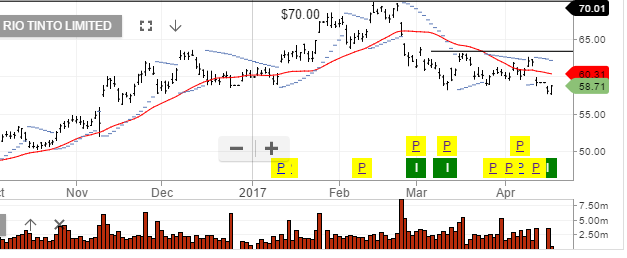
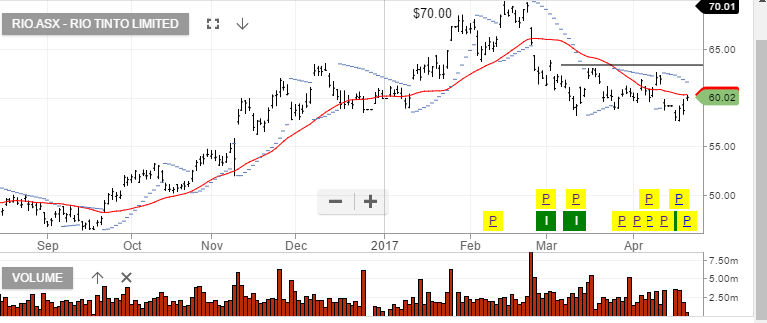
Both RIO and BHP have traded lower on the open,  reaching new 5-month lows of $57.60 and $23.30, respectively.

Unless Iron Ore stages a dramatic rebound, we look for the the next key support level in RIO at $56.20, and at $22.60 for BHP. 


Goldman Sachs – Q1 17 Earnings Result

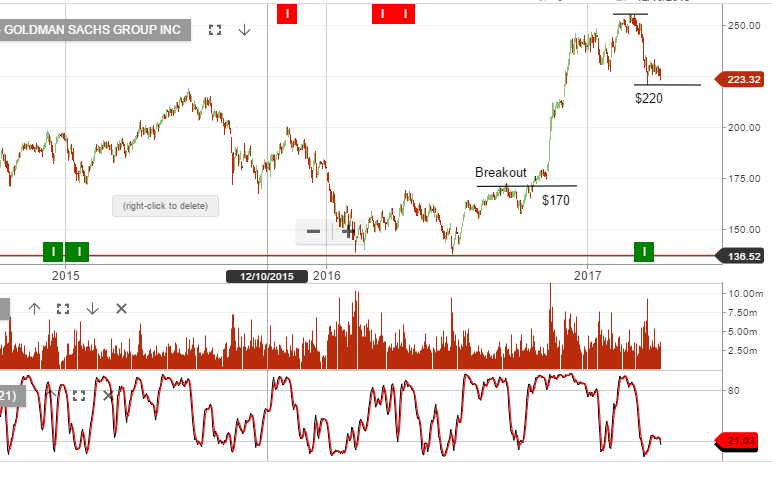
Goldman shares dropped more than 5 percent overnight to trade at their lowest since the end of November and are down 10 percent for the year so far. The US financials sector is about 1 percent lower year to date

Goldman Sachs reported 1Q earnings per share of $5.15 a share, missing a consensus estimate by 16 cents. Revenue came in short by about $420 million at $8.026 billion.

The last time Goldman reported a miss on earnings per share was the fourth quarter of 2015.

Technical buying support may start to build at or near $200.

Chart – Goldman Sachs


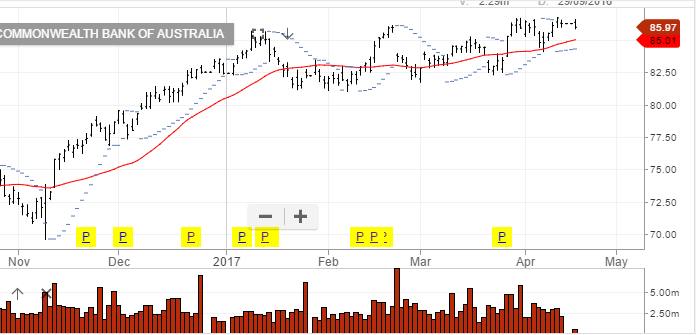
CBA Nears Key Resistance

Australian banks are currently trading at lofty levels and close to significant chart resistance points.

We consider CBA to be most vulnerable to a down side correction considering the technical pattern and the premium at which it trades to its peers.

Going back to December 2015, there have been four occasions when CBA shares traded into the $85.00  to $86.00 price range before rolling over for a 5 to 10% correction. At this point, we are looking for a technical move back to the $80.00 level.

Fundamentally, huge consumer debt burdens, stagnant domestic wages growth and an overheated housing market will likely act as a headwind to further meaningful price appreciation.

Investors holding long CBA positions can look to sell covered calls into June, or buy the May $83.00 outright put option.


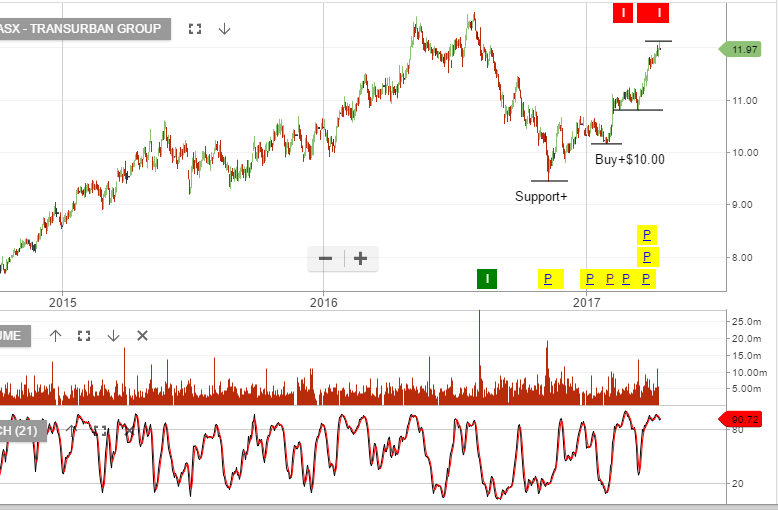
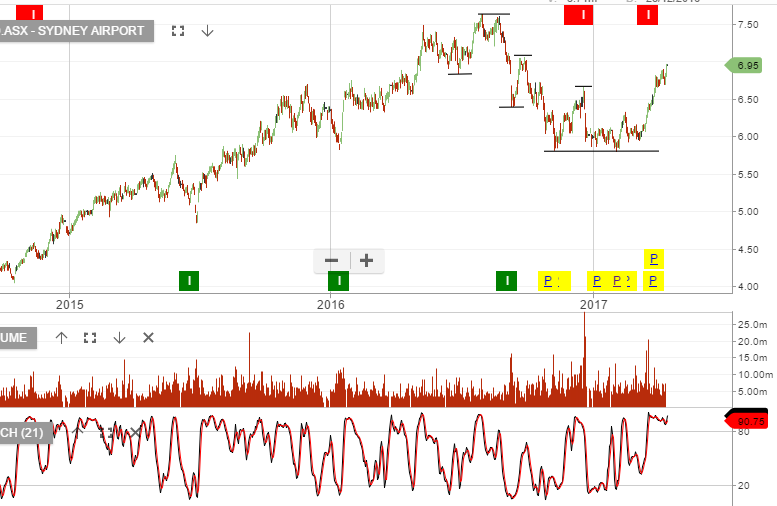
ASX Yield Sensitive Names Rally

With bond yields moving lower in the US, we’ve seen strong buying interest in domestic yield sensitive names.

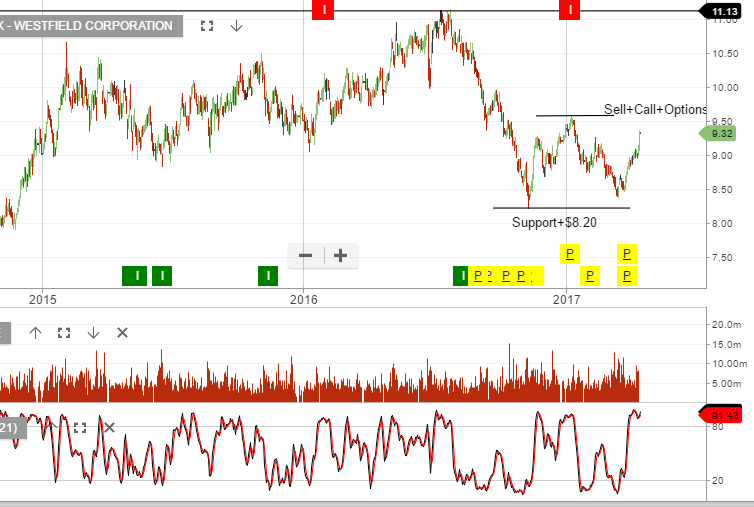
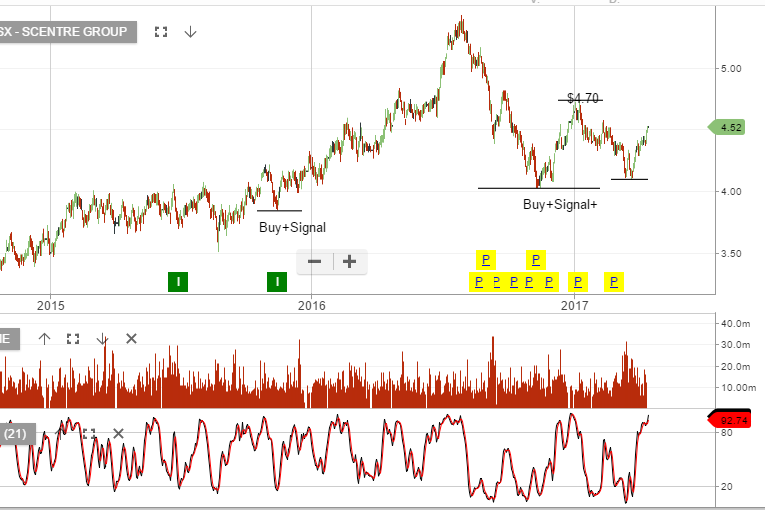
The rally is nearing the peak and taking profit  or selling tight covered calls is advised. History shows yields compressing below 4% will act as resistance for further share price advances.

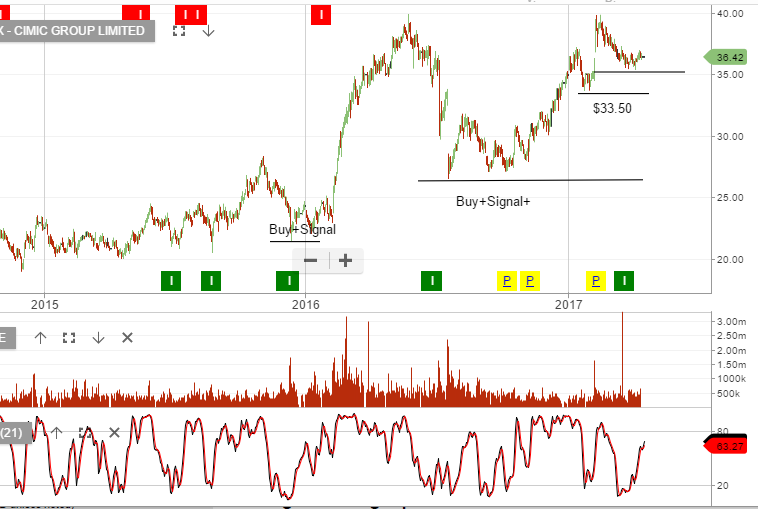
Chart – TCL
Chart – SYD
Chart – WFD
Chart – SCG


JP Morgan Slips 1% After Q1 Earnings Report

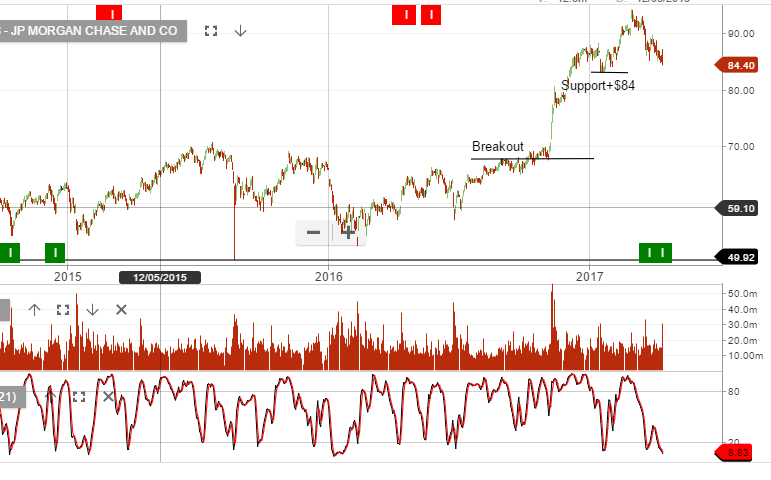
Shares of JP Morgan fell over 1% today as their Q1 earnings report included a sharp increase in write-downs.

The company reported earnings of $1.65 per share, which was up from an adjusted $1.35 reported a year ago and higher than the street estimates of $1.52.

However, concerns emerged in the bank’s consumer group, where credit costs surged to $1.4 billion, up almost $400 million from Q4 2016. This expense was driven by higher credit card charge offs.

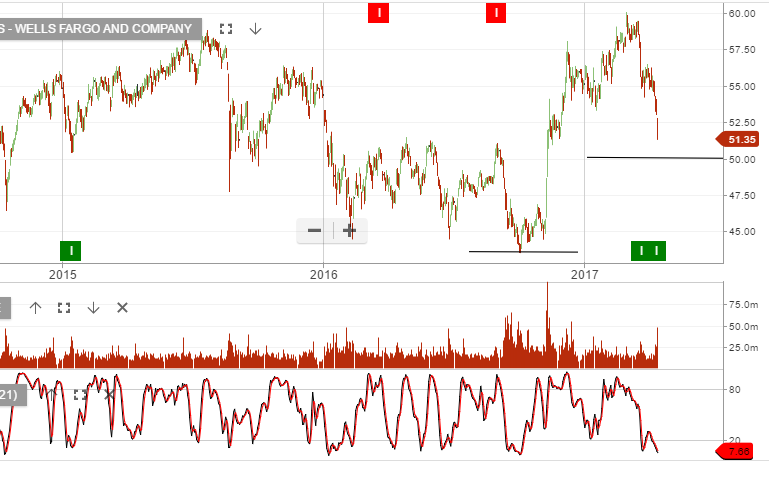
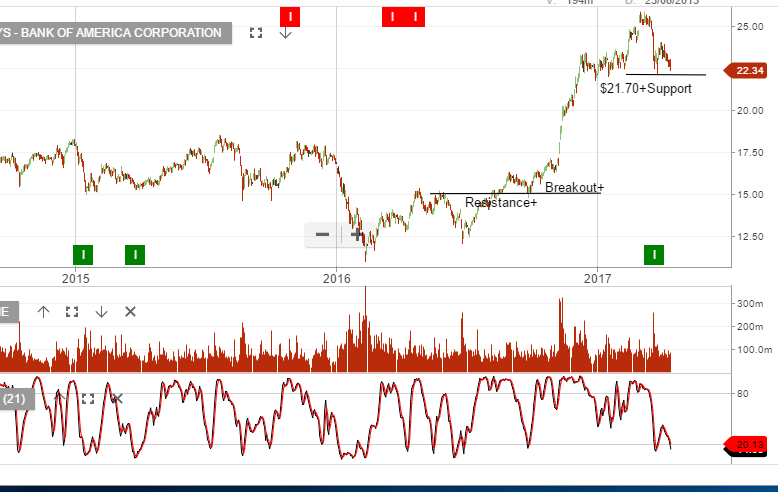
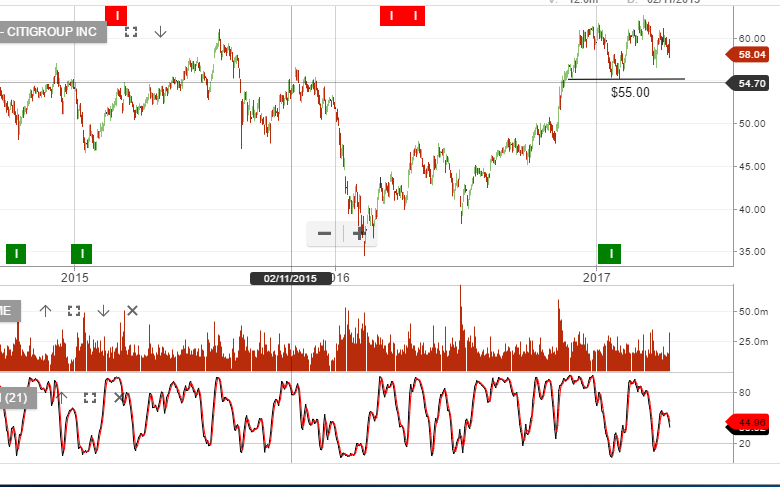
As the other major US banks report their earnings next week, we will watch for similar write downs as a source of selling pressure.

JPM shares closed at $84.40, which is over 11% lower than the $94.00 high posted on March 1st.