ETF UPDATE: Aussie Dollar Pointing Lower

Since early January, the AUD/USD  has traded in a 250 point range between .7500 and .7750.

Now that the FED has raised rates this year (and has given guidance for more tightening) the yield differential between the overnight rates between Australia and the USA has narrowed to just 50 basis points.

This compares to 200 basis points this time last year.

In addition, with domestic employment growth sputtering and lower inflation readings, the RBA has maintained an easing bias for overnight rates in Australia.

This strengthens the case for the AUD/USD to trade lower and return to the December lows of .7150.

Investors looking to profit from a falling AUD/USD have been buying the BetaShare YANK Exchange Traded Fund (ETF). The current unit price of YANK is $14.10.

We estimate that a move back to the December low of .7150 would increase the unit value of YANK to approximately $16.75.
ALGO Signal- Ansell

The Algo engine generated a sell signal for Ansell at the close of trade yesterday.

From a technical perspective, Ansell’s closing price of just under $23.00 is very close to the 50% retracement  of the high of $25.65 traded on January 9th and the low price of $20.60 posted on February 20th.

While we still like the longer-term growth prospects of the company, we are seeing signs that the general market may be rotating lower over the medium term.

As such, we believe its reasonable to expect that investors will be able to buy Ansell back below the $22.00 handle.

The current price of $23.35 offers a good opportunity to sell close-to-the-money call options to enhance portfolio returns.

Algo Signal – US Financials

With the recent sell-off in US equities, we’re now seeing a number of Algo long signals appear in the US financial names.

We’re mindful of the “peak optimism” that is priced in regarding tax cuts, deregulation & US economic pickup and approach these buy signals with caution.

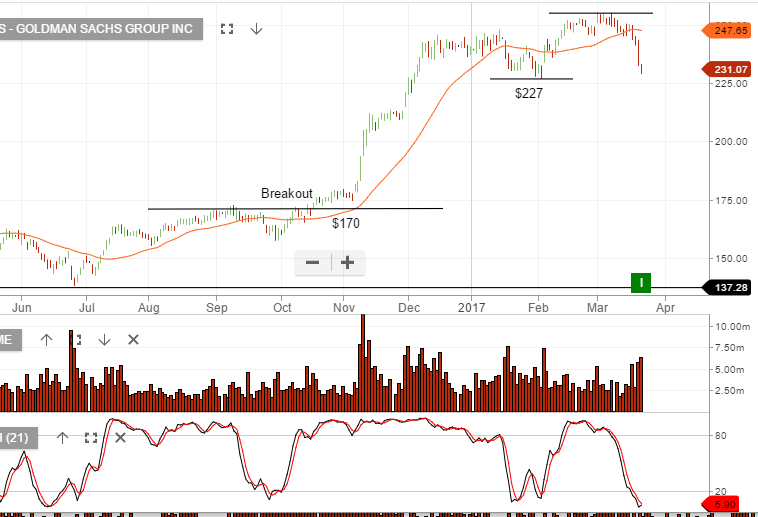
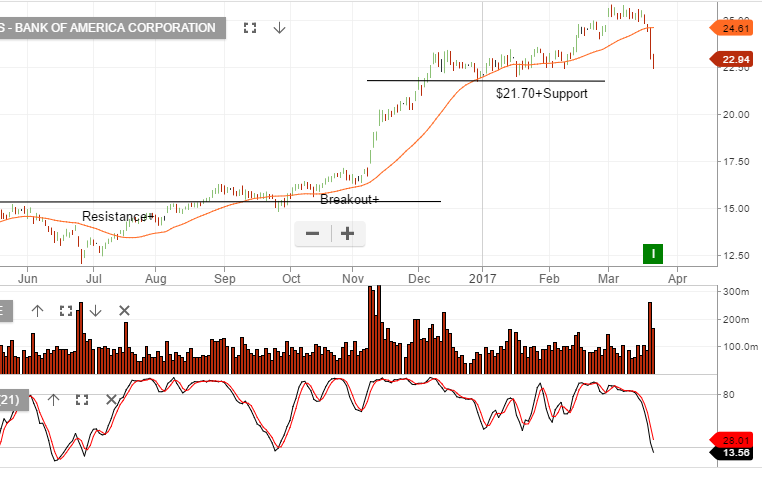
We’ll be tracking the short term momentum indicators in Goldman Sachs and Bank of America as a leading indicator to market sentiment.


Chart – GS
Chart – Bank of America


Heavy Losses On Wall Street

Both the DOW Jones 30 and SP 500 index fell over 1% today during the worst trading session for 2017 for US Blue-Chip stocks.

Banking names led the hefty losses, with the DJ Banking Index trading back below the 50-day moving average.

Dow/SP component Goldman Sachs lost almost $10.00 on the day and is now 10% lower than the March 1st close of $253.00.

A confluence of lower loan growth, political uncertainty and extended valuations pressured the banks, as well as the general market, lower on very high trading volume.

Technically, both the DOW Jones and the SP 500 have posted their first close below the 30-day moving average since November 7th.

The unwinding of the overbought conditions in many of the index components will likely be a process more than an event.

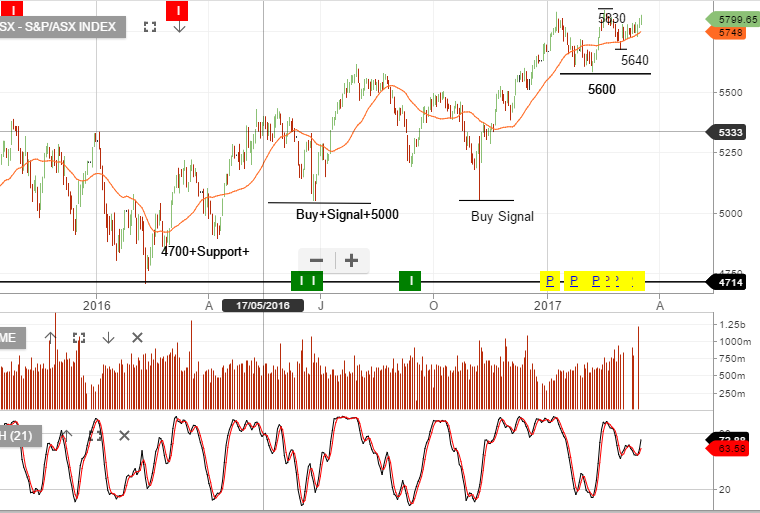
With the banking sector very heavily weighted in the ASX 100, this process will likely pressure Australian names lower, as well.

Investors who are looking to hedge their portfolios or profit from a down move in the ASX can trade either the BetaShare  BBOZ  or BEAR Exchange Traded Funds.

These are inverse funds which gain value as the ASX index trade lower. Please call for more information.

Gold/Newcrest Break Higher

As Wall Street stocks moved lower, gold prices continued to attract “safe haven” flows.

As mentioned in our earlier post, the yellow metal met technical resistance at the 30-day moving average price of $1230.00 last Friday.

However, with global equities correcting from recent highs, the next key resistance level will be the February 27th high of $1263.00.

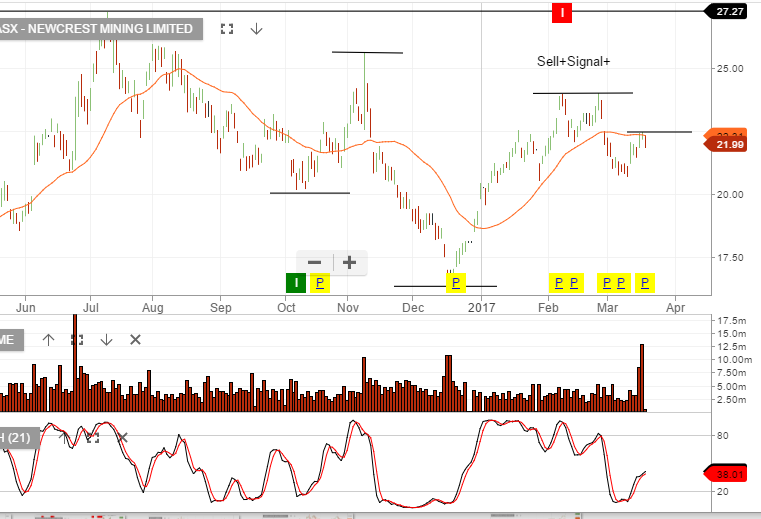
Similarly, shares of Newcrest Mining have broken above the 30-day moving average and now look set to test the February 23rd high at $23.45

Algo Signal – SYD & TCL

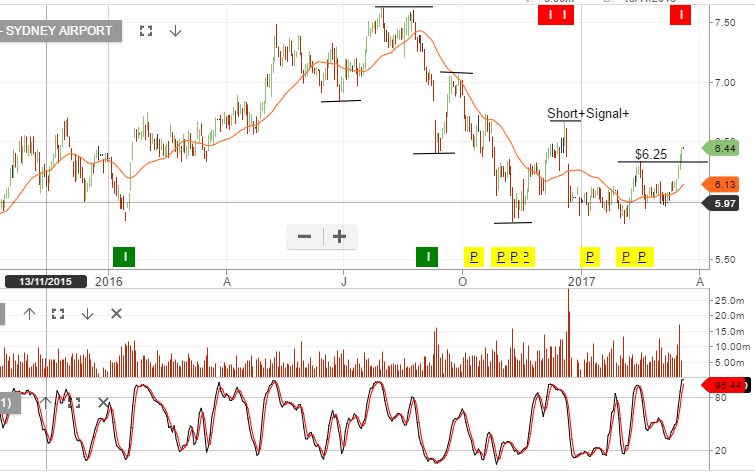
The Algo Engine flagged SYD as a short signal yesterday. At this stage, we’re thinking SYD trades sideways, (rather than lower), and consolidates heading into the June dividend.

With the stock at or near $6.50, it places SYD on a 5% yield and when complimented with a tight covered call, we’re able to generate 12% annualized cash flow. If price breakdowns below $6.25, we’ll reassess the strategy.

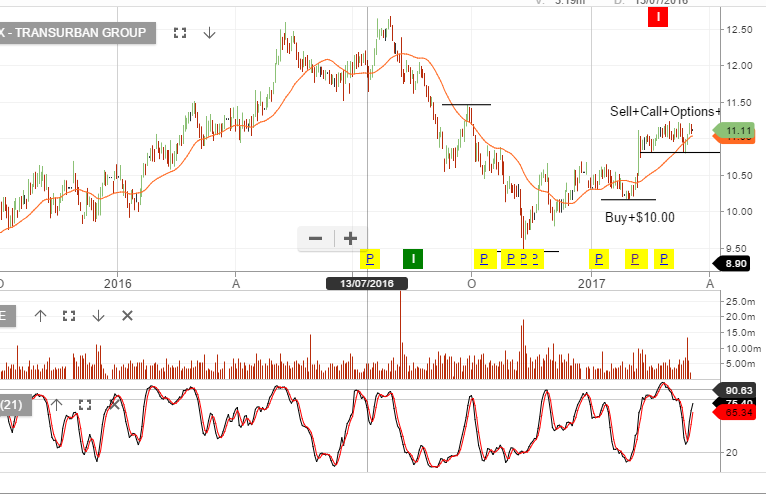
Utilities & REIT’s, (SYD & TCL), are benefiting from US yields retreating from recent highs.

Chart – SYD
Chart – TCL


GOLD/Newcrest Approach Resistance Levels

Both the share price of Newcrest Mining and Spot Gold rallied sharply last week.

As such, both are now trading against the key technical resistance at the 30-day moving average areas of $22.00 and $1230.00, respectfully.

Looking ahead, the question is whether the inverse correlation between global equity prices and Gold continues, and whether that will continue to lift the shares of Newcrest?

On Friday, the daily trading volume in Newcrest was 12.7 million shares.

This is more than twice the average daily turnover of 5.5 million and the largest volume day since 18.5 million shares were traded on June 24th, 2016.

Generally, an up-day in the share price, on expanding volume, is a positive sign for further gains in the share price.

At this point, we don’t have a buy signal from the ALGO engine but will watch the price action closely.

Chart – NCM