Quality On Sale – LLC, ASX, CSL & ALL (Video Link)
Lendlease, ASX, CSL and Aristocrat are names that we covered in Monday’s Opportunities in Review webinar.
Again, we draw your attention to these high quality businesses that have seen a recent correction in their share price.
We believe these names are close to finding support and should be the focus of establishing entry conditions. Watch the short-term momentum indicators for a reversal higher.
Click below to watch the short two minute video
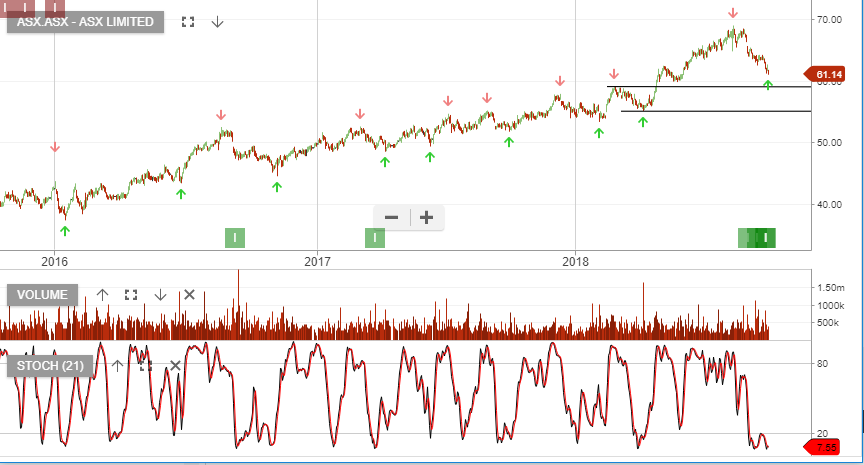
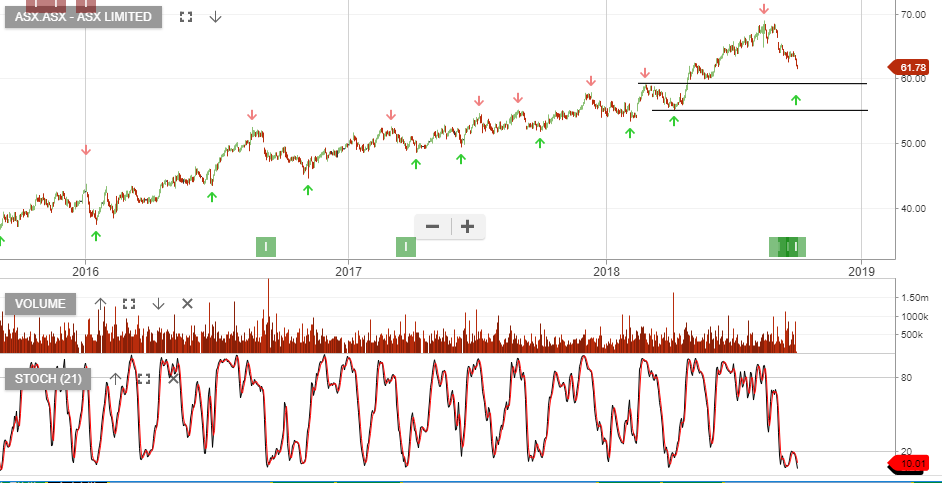
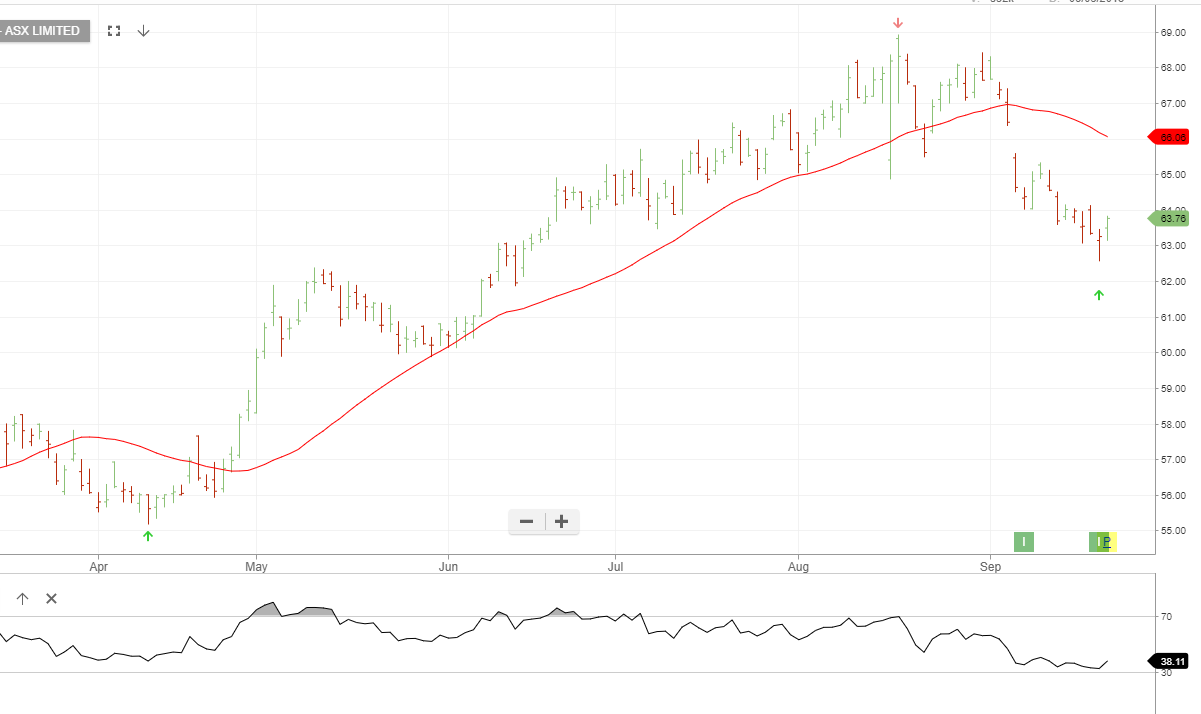
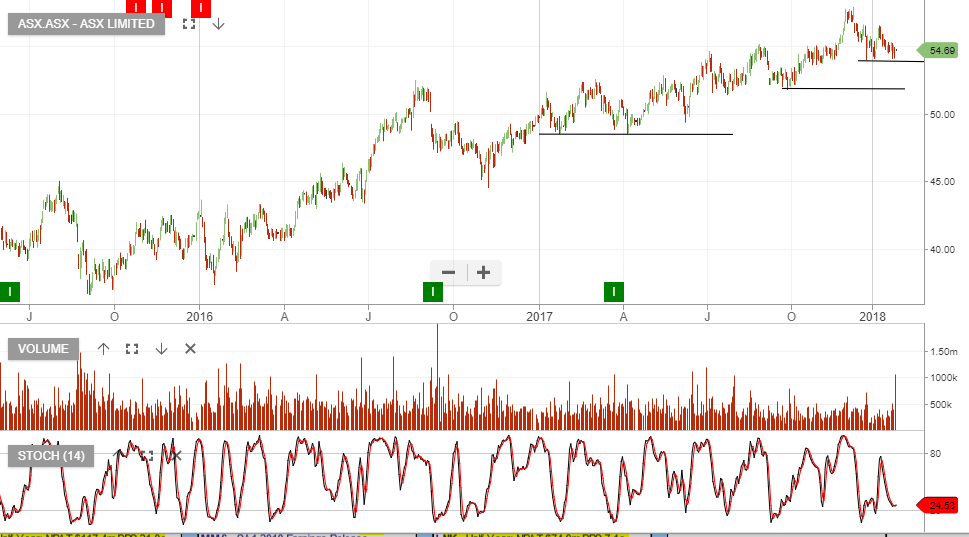
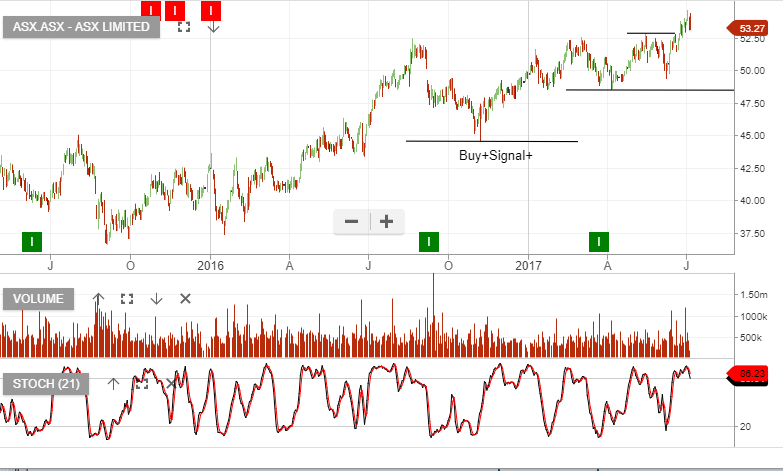
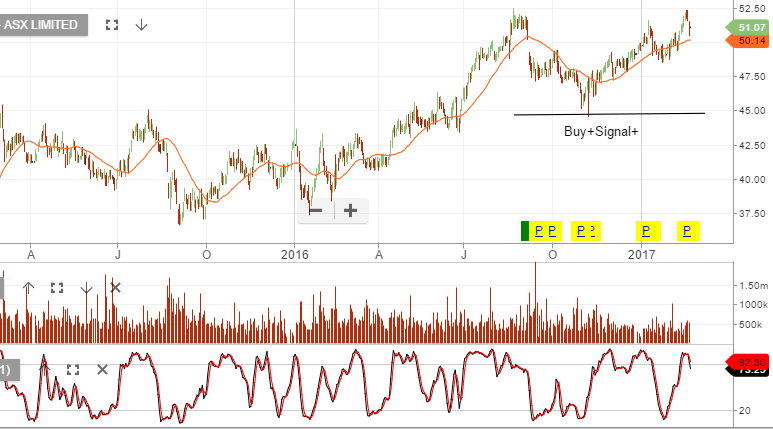
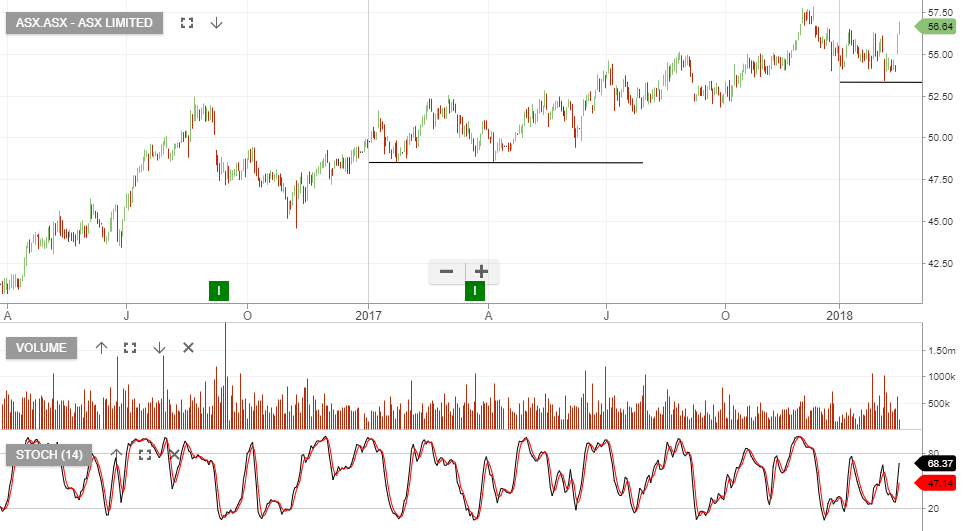 ASX:ASX