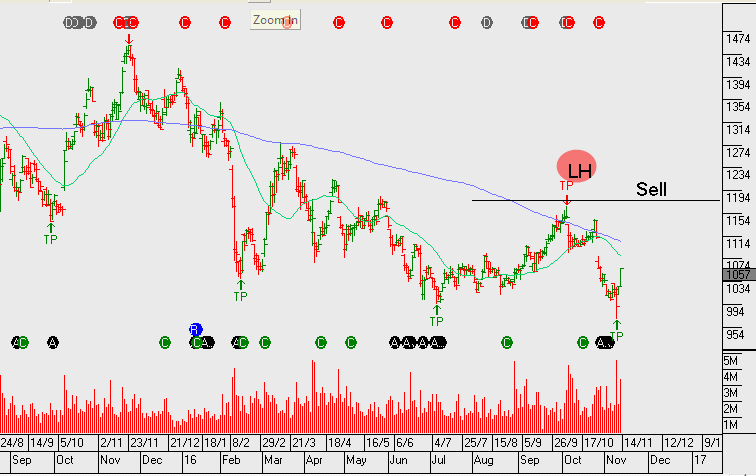
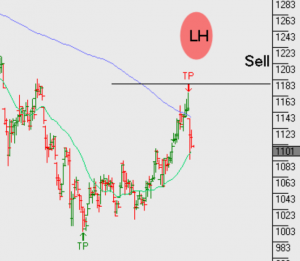
Australian Bank Trends – WBC & ANZ Breakout

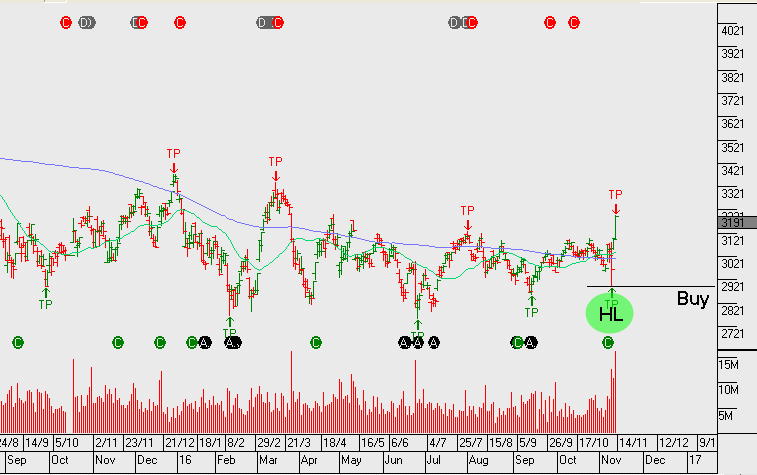
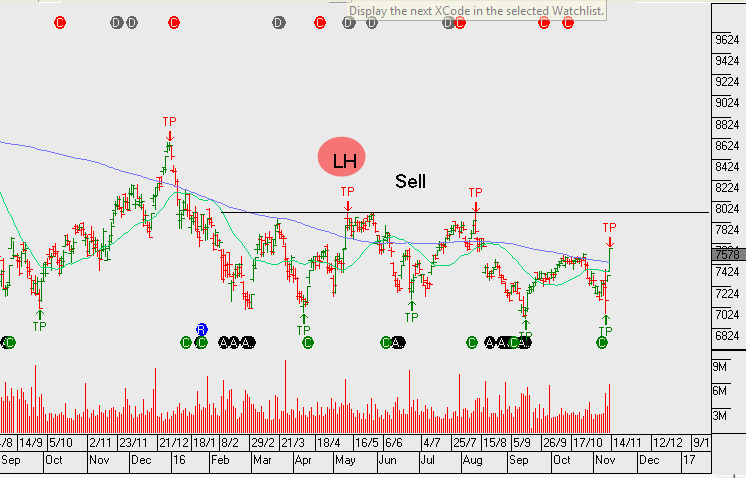
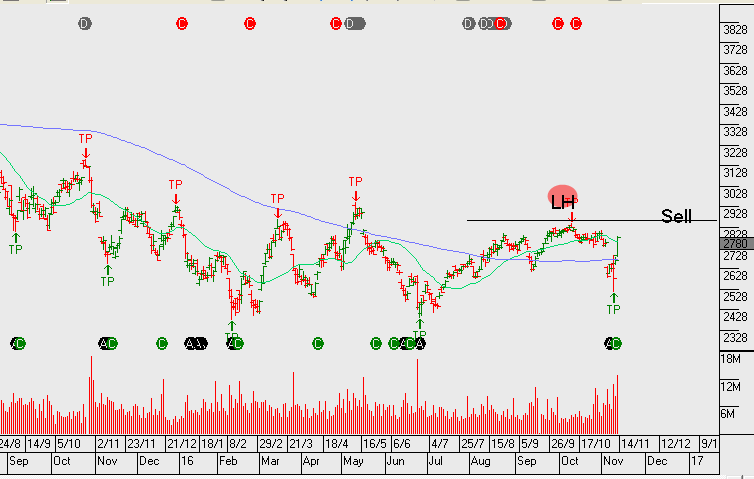
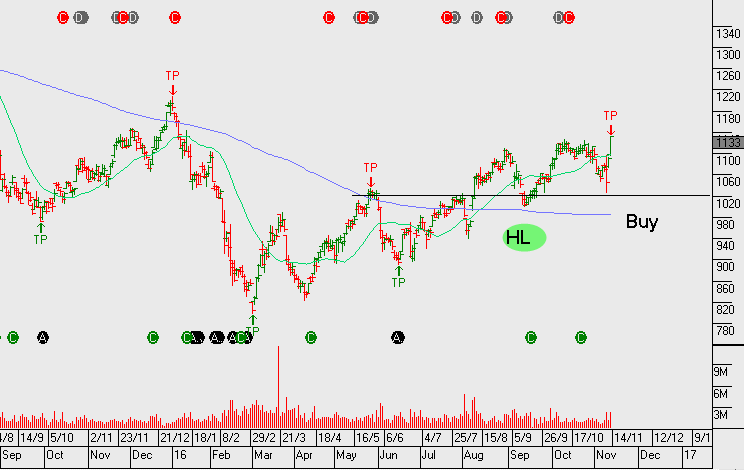
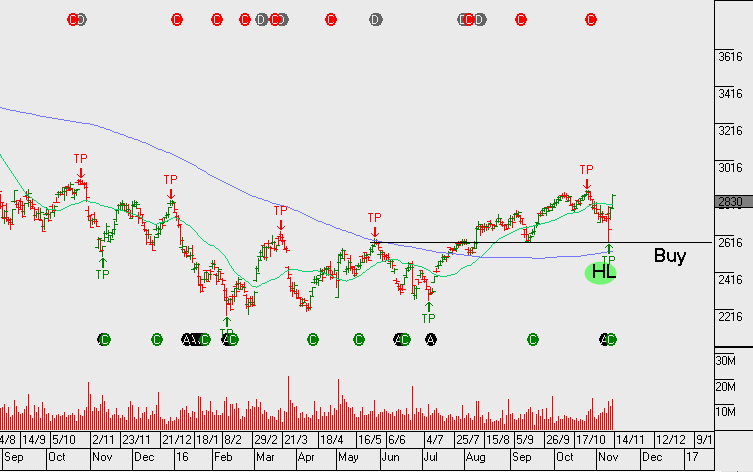
We now have ANZ and WBC creating a higher low formation. However, CBA and NAB still remain below the recent highs within the downtrend that’s been in place since May 2015.

Back in August, ANZ was the first to break the downtrend and now WBC has followed. Within the regional banks, between BOQ and BEN, it’s Bendigo that’s displaying a more bullish price pattern.

Although the breakout in financials is strong at present, we don’t see too much further upside. As reflected in the recent earnings results, the banks are having difficulties growing top line revenue. Our largest bank exposure in client portfolios is Westpac. We’ve left this name uncovered at present, however, it’s likely we’ll identify a point this week to add covered calls to enhance the yield.

ANZ goes ex-dividend $0.80 on Monday & WBC also goes ex-dividend $1.00 on Monday.
anz
Chart – ANZ
wbc
Chart – WBC
cba
Chart – CBA
nab
Chart NAB
Chart - BEN
Chart – BEN
boq
Chart BOQ

BOQ FY16 Earnings Result

A quick look at Bank of Queensland and Bendigo following the release of the BOQ FY16 earnings result.  BOQ.ASX Underlying result was weaker than market expectations, predominately driven by greater than expected margin pressure.

BOQ.ASX FY17 outlook now appears to offer flat EPS growth at best, assuming a $0.78 FY17 dividend, it places the stock on a 6.9% fully franked forward yield.

BOQ.ASX

boq

BEN.ASX

ben

A technical summary of where we see price action heading is different in BOQ opposed to BEN, whilst we see short term downside pressure in both names, (despite the yield support), a retracement in BEN.ASX back to $10 will likely trigger a buy signal in our algorithm engines. Whereas, BOQ.ASX remains in a structural downtrend and it’s the current short signal that draws our attention.