Rotation Out Of Banking Stocks
Since Treasurer Scott Morrison announced a banking levy in the May 9th budget, banking stocks have been sold off across the board.
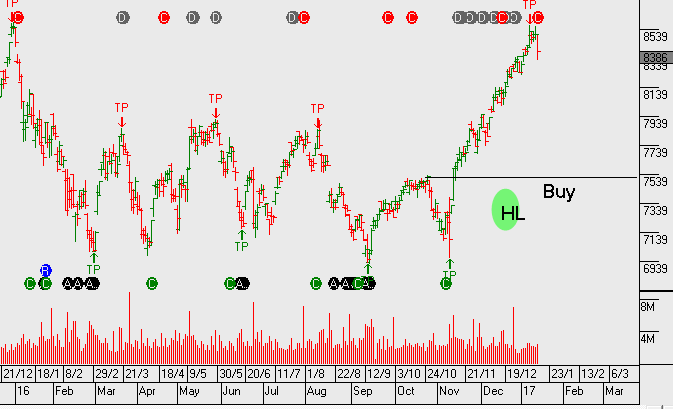
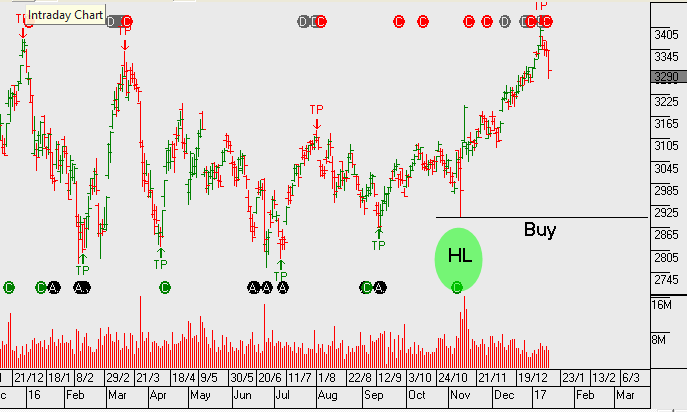
It’s become clear that a fair percentage of this investment flow has rotated into the local Insurance names with IAG and Suncorp both posting material gains since early May.
We hold both of these stocks in client portfolios and they are now up 12% and 8% since mid-May, respectfully.
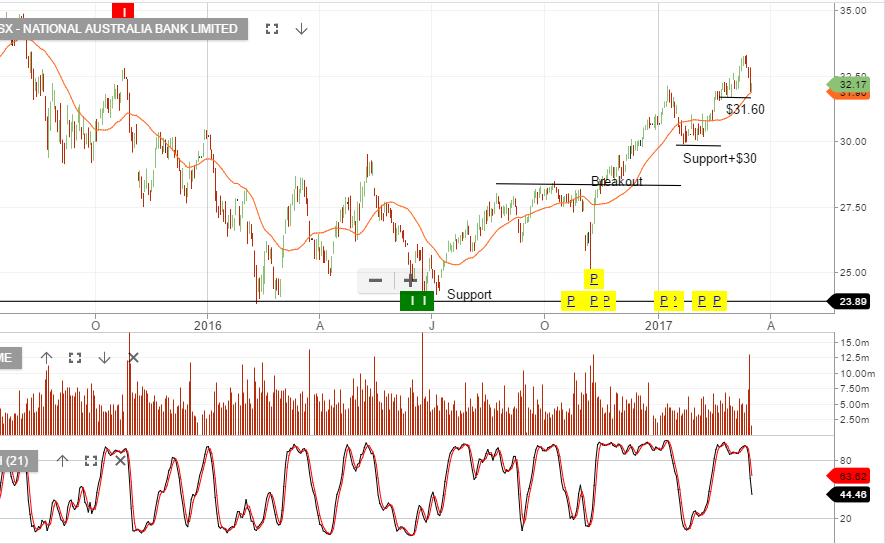
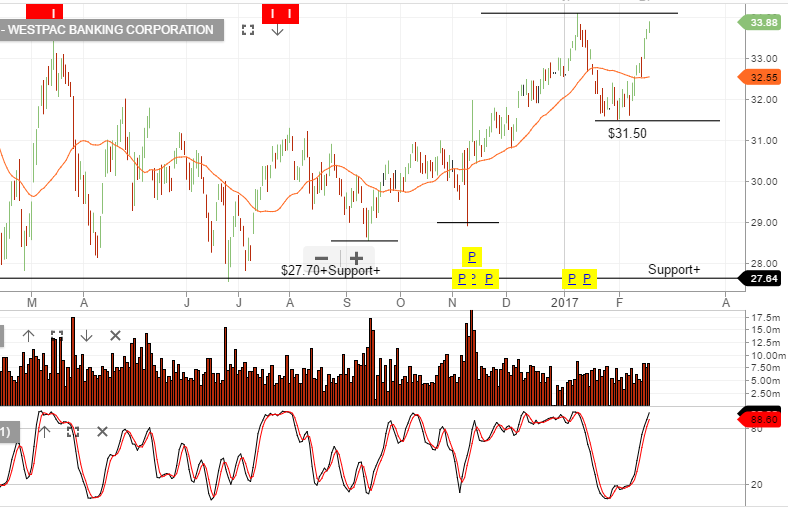
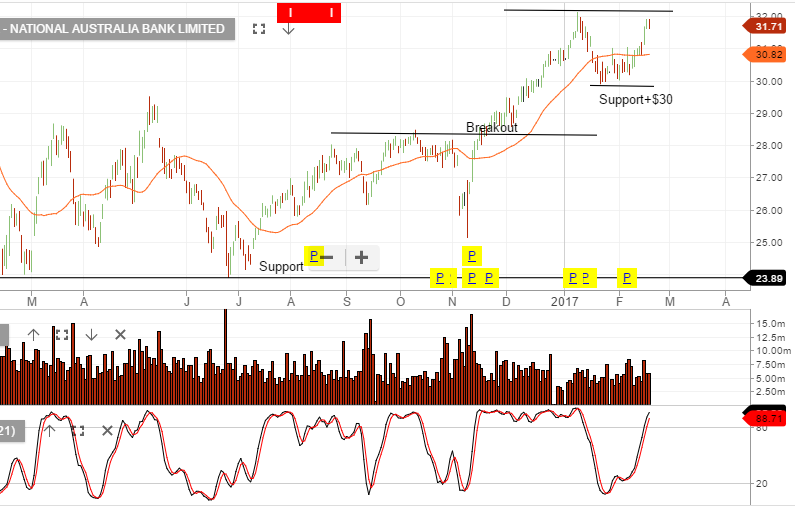
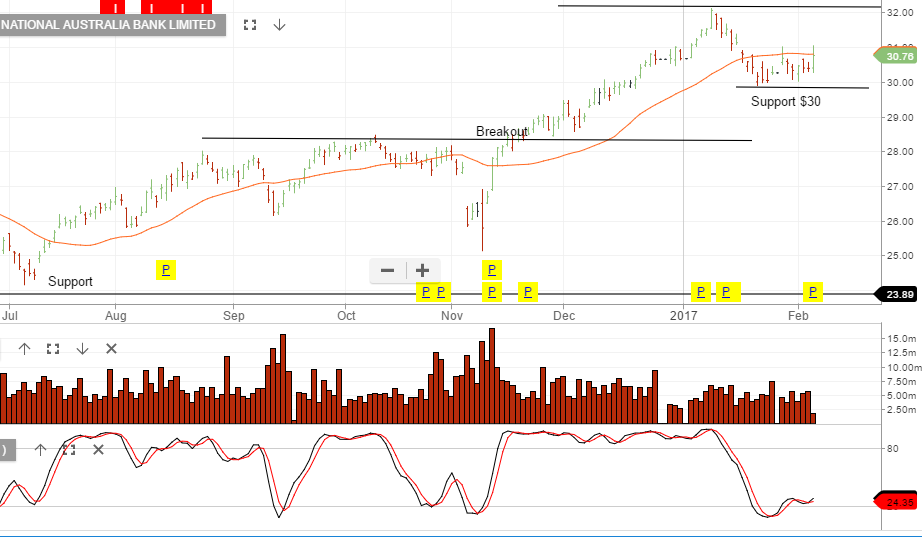
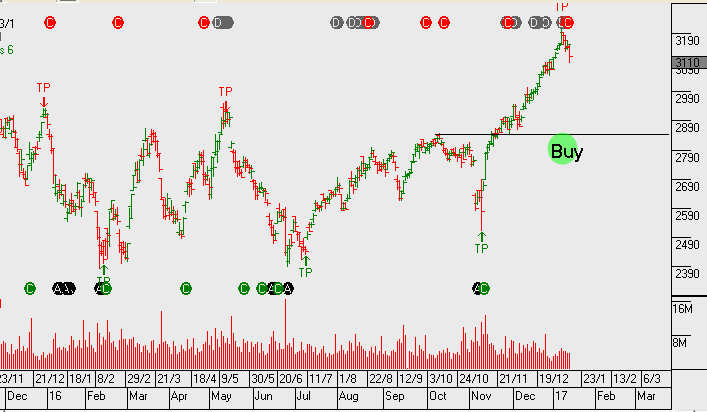
With respect to the re-valuation in the banking shares, NAB has posted a fresh low at 29.00 in early trade today.
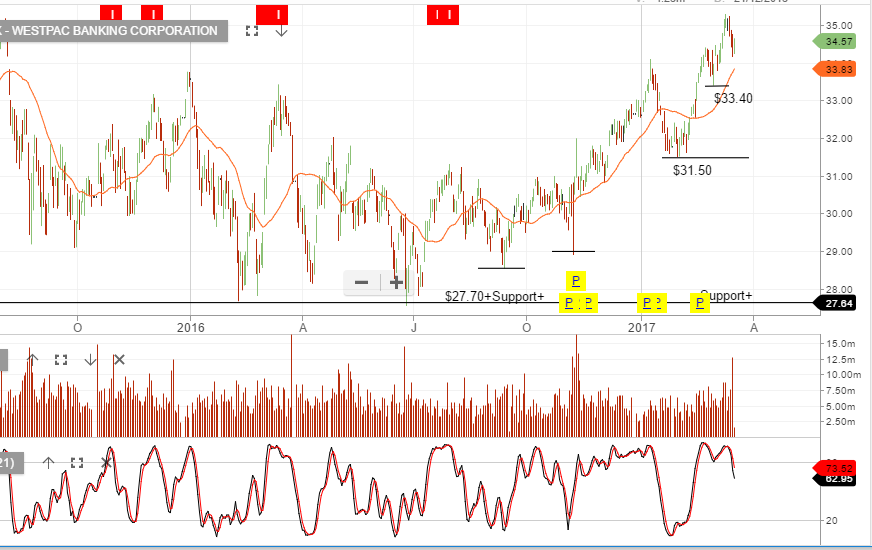
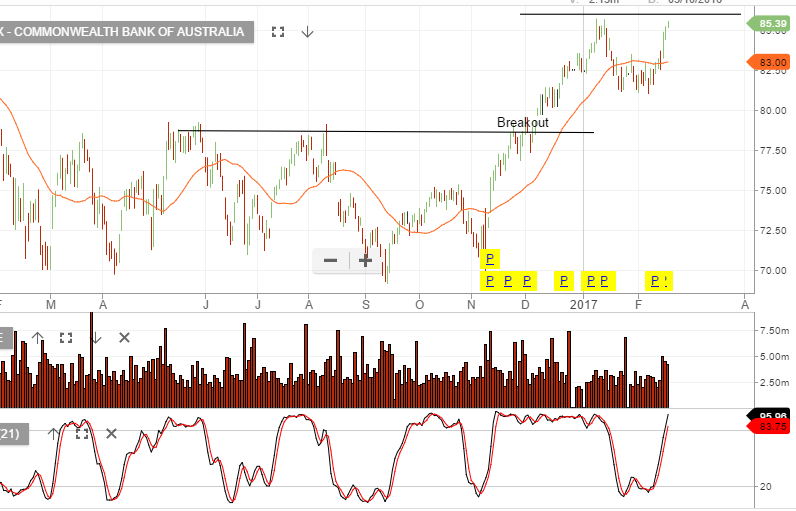
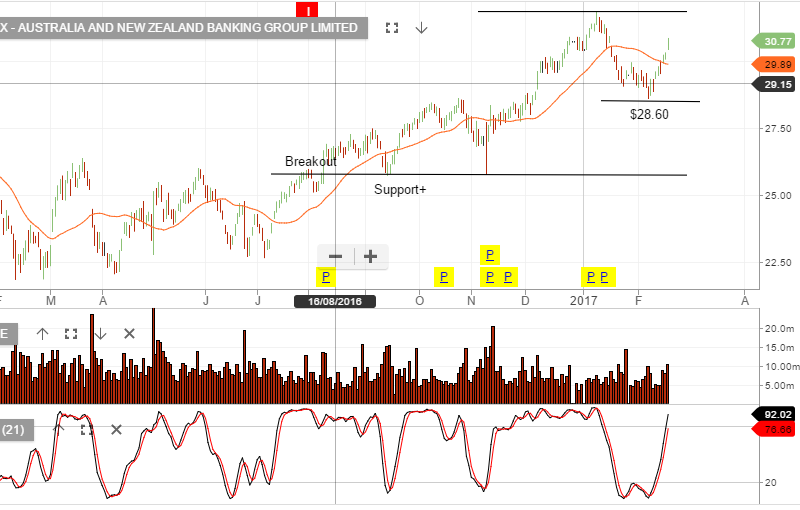
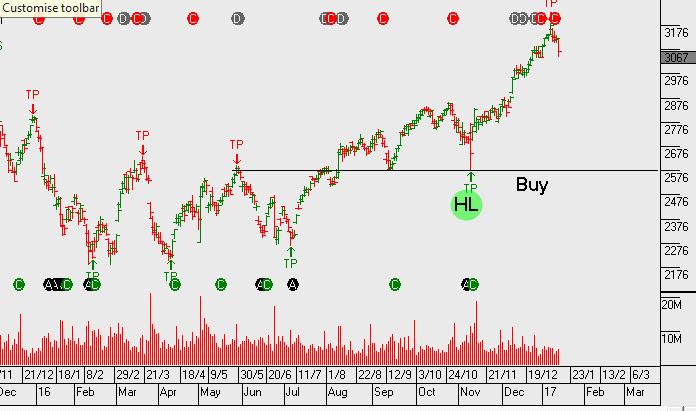
Both WBC and ANZ are approaching the lows posted in early June, while MQG and CBA have held up better but are still pointing lower.
On balance, we continue to expect to see rotation out of the banking names to the benefit of the insurance stocks.
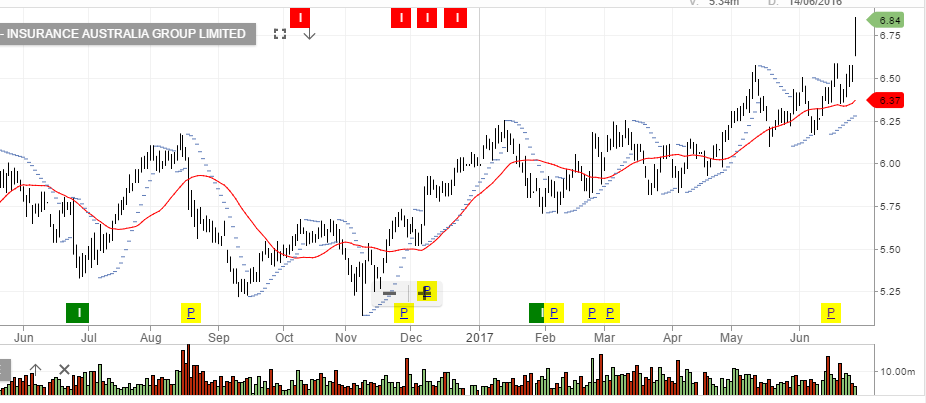
IAG
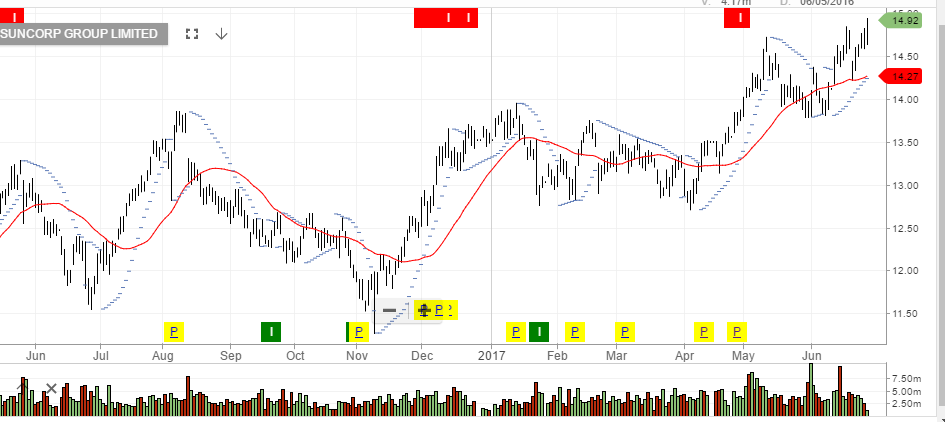
Suncorp
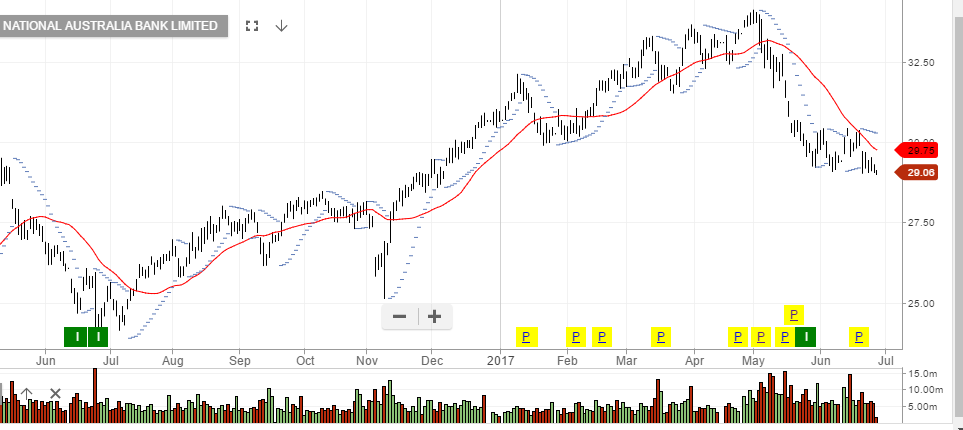
NAB
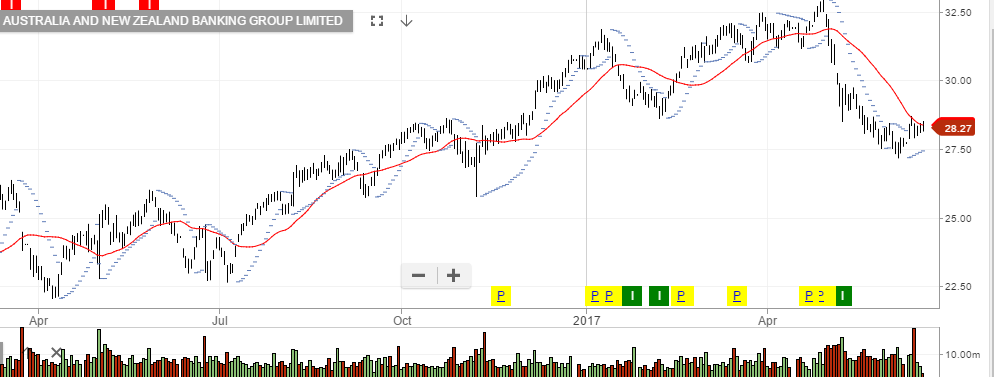
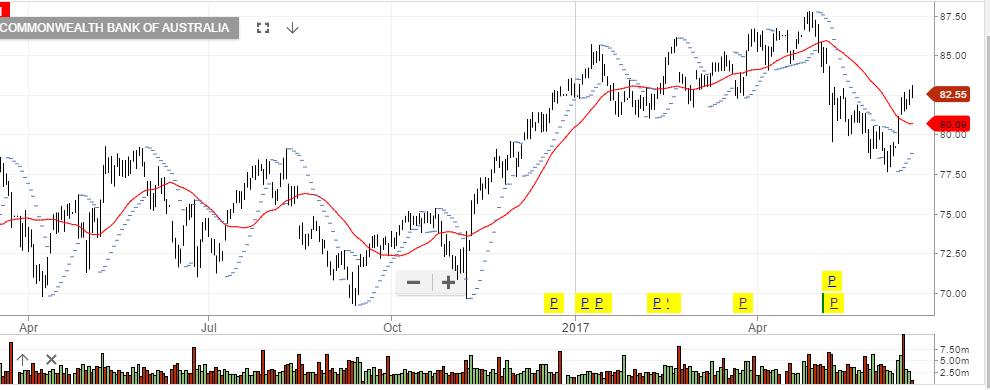
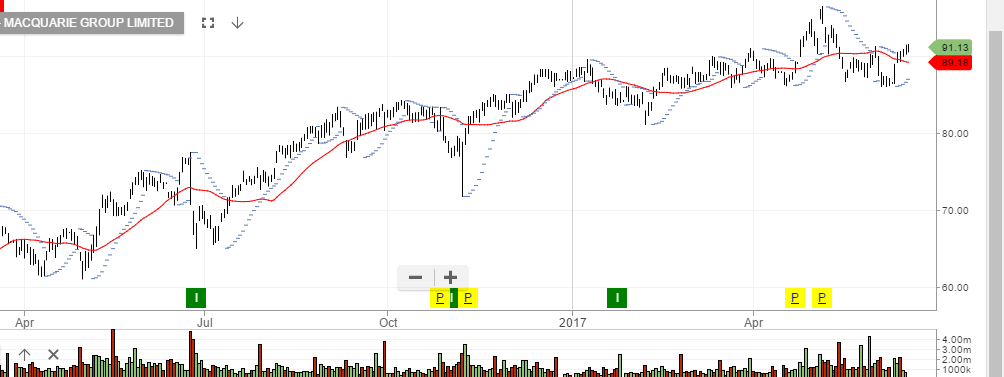
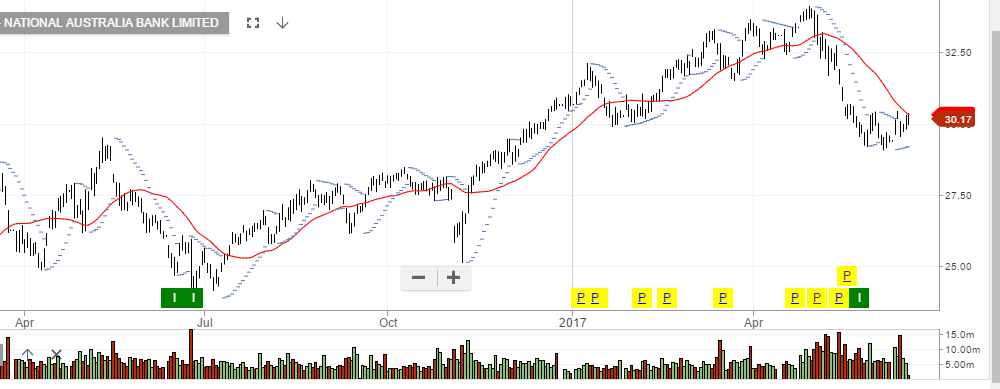
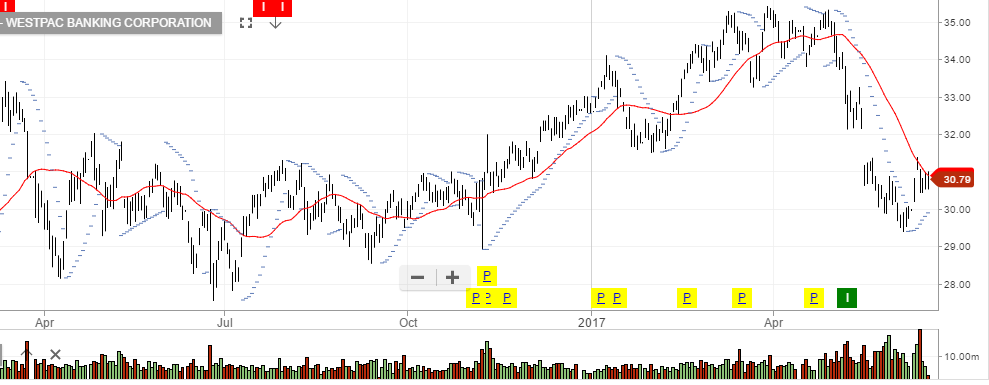
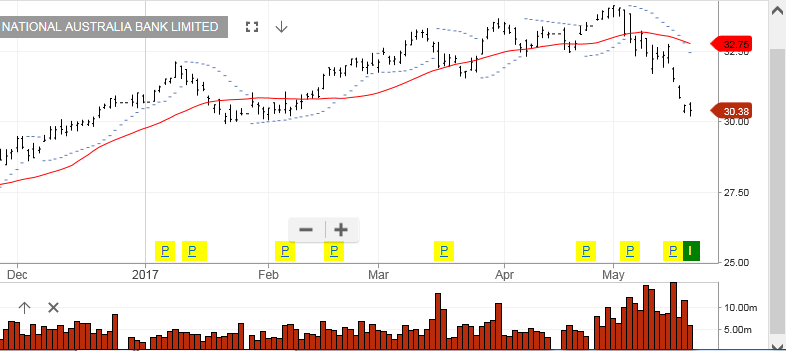
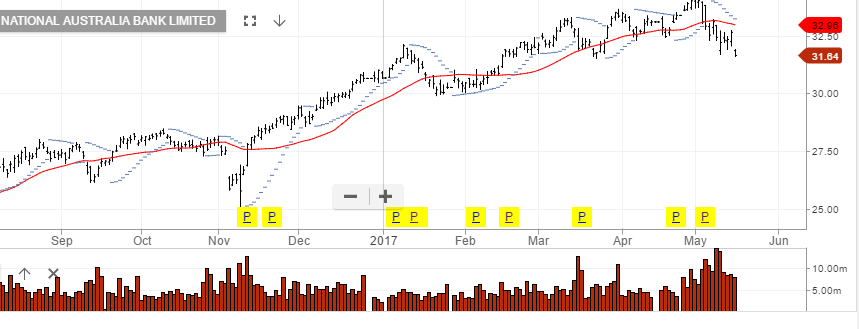
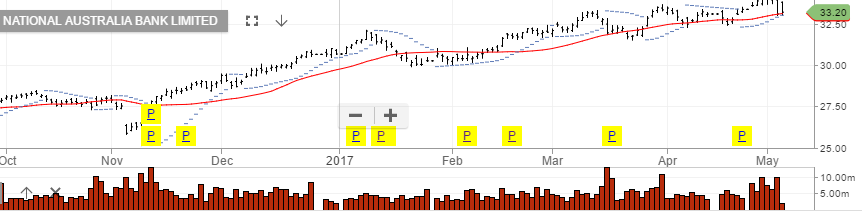
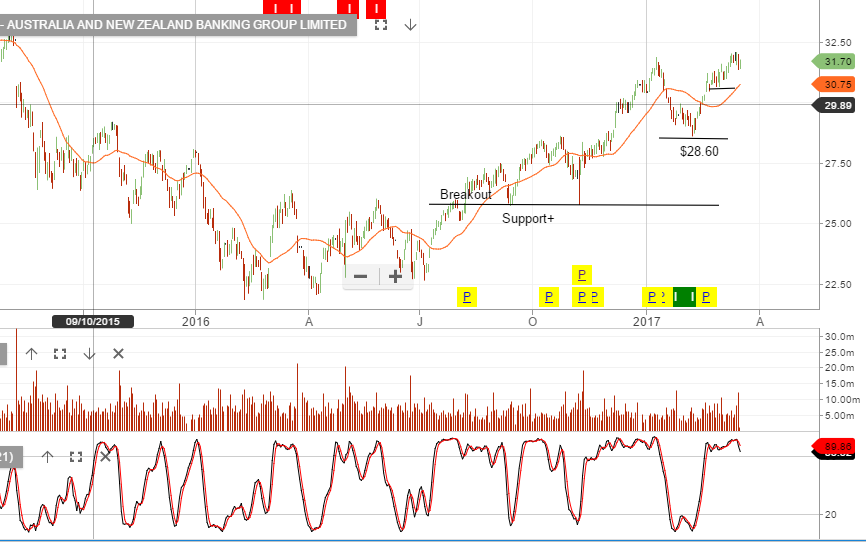 Chart – ANZ