Inner Circle
- INTC.NASDAQ: Q2 2026 earnings are expected on July 23, 2026.
- HON.NASDAQ: Q2 2026 earnings, including the first post-spin results, are expected on July 23, 2026.
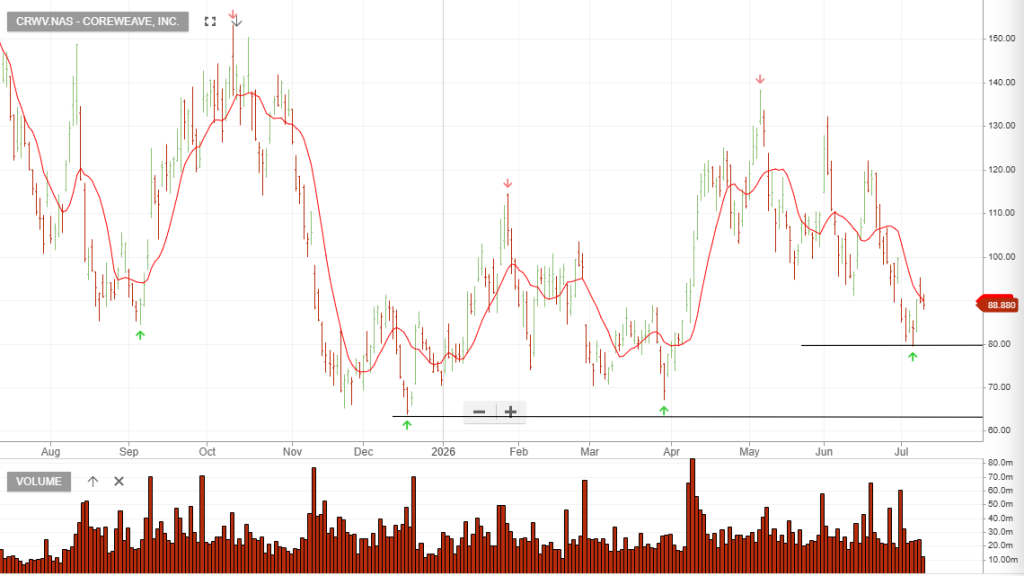
{NAS.CRWV}
Full-Year FY 2026 Guidance: The company has reaffirmed full-year revenue guidance of $12.0 billion to $13.0 billion (with consensus currently sitting at $12.6 billion). This represents an incredible ~146% year-over-year growth rate compared to FY 2025 revenue of $5.13 billion.
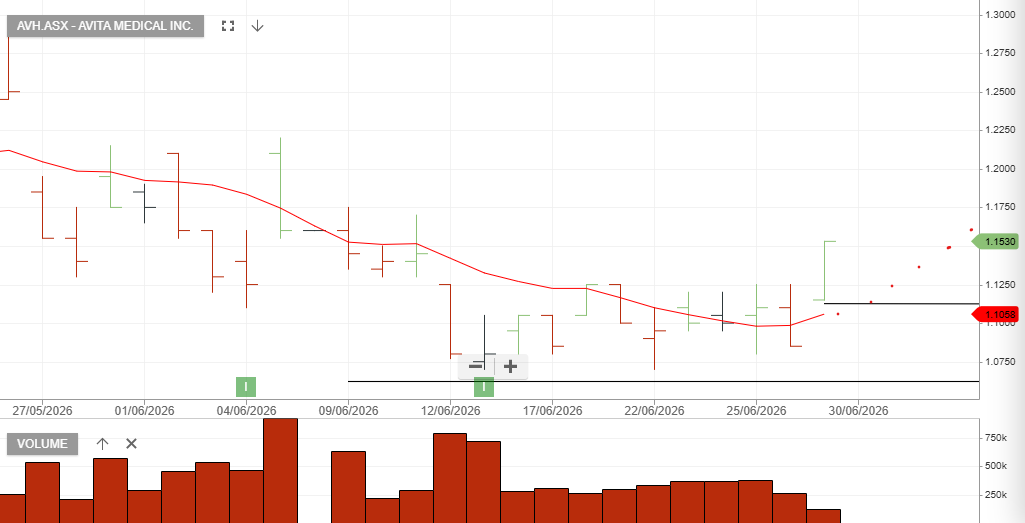
Avita Medical is a commercial-stage regenerative medicine company focused on acute wound care and therapeutic skin restoration.
Revenue Growth: Q1 2026 revenue reached $19.3 million USD, a 4% year-over-year increase and a 10% sequential increase from Q4 2025, showing gradual recovery following reimbursement and distribution disruptions in late 2025.
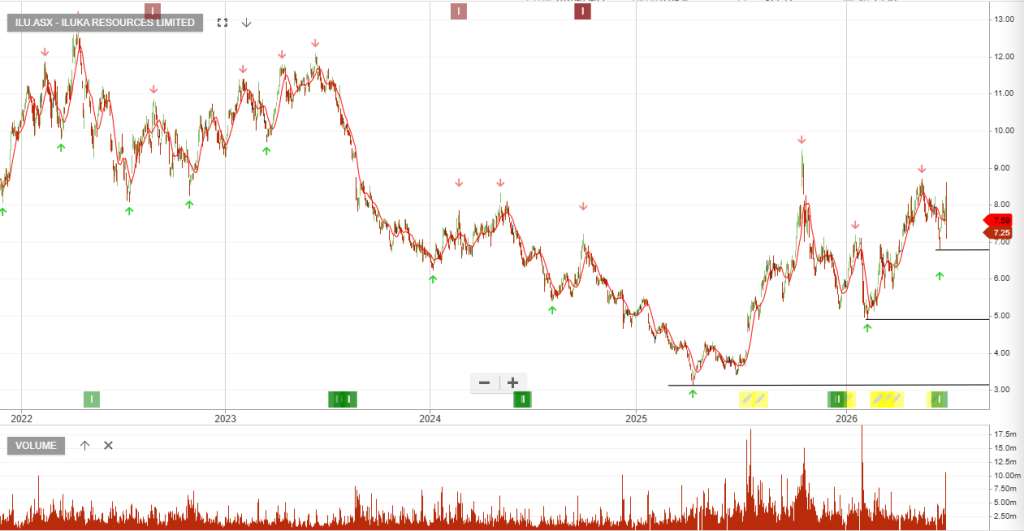
Iluka Resources earnings forecasts reduced due to the slower ramp-up profile.
First Rare Earths Offtake Agreement Secured
Production Ramp-Up Appears Slower Than Expected
Eneabba Refinery Funding and Construction De-Risked
The offtake agreement is a strategic positive that validates Eneabba’s rare earth project, but the market may need to temper expectations around the speed of production ramp-up. Macquarie remains constructive on the longer-term rare earths opportunity.
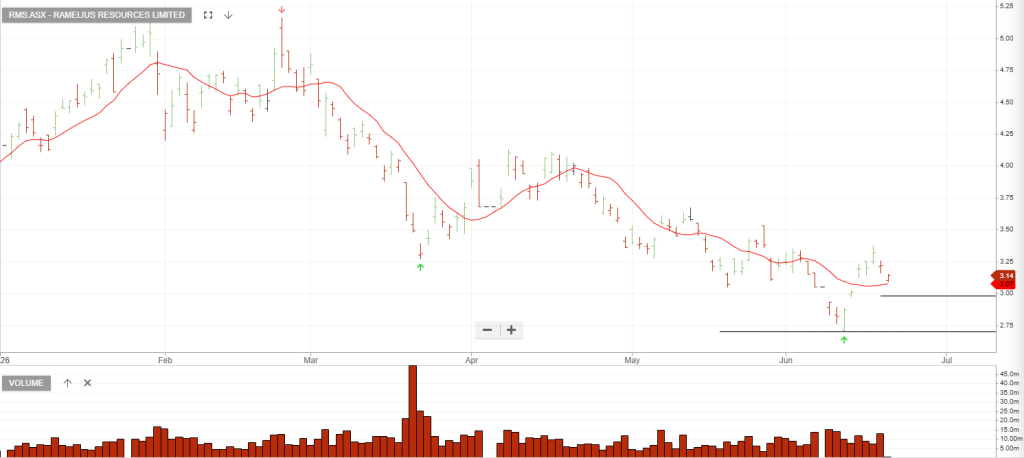
Buy with the stop loss at $2.97.
Statutory figures were heavily impacted by the acquisition of Spartan Resources.
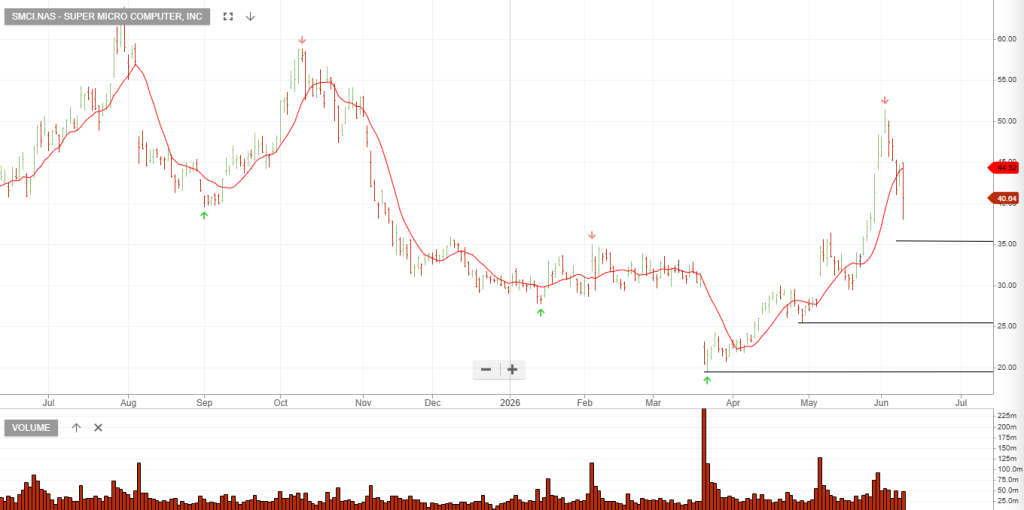
NAS: SMCI said it plans to raise $7 billion in equity-related sales to cover the costs of hardware component purchases. The company also said it’s received $39 billion in artificial intelligence server orders in recent weeks.
CSL appears to be approaching a profitability low point in FY26, with FY27 expected to mark a return to earnings growth. Management’s transformation initiatives, lower plasma collection costs, and the removal of excess immunoglobulin (Ig) inventory from the US market should support margin recovery and earnings improvement. While challenges remain from competitive pressures in Ig, albumin, KCentra and Vifor pricing, the company is positioned to deliver modest profit growth.

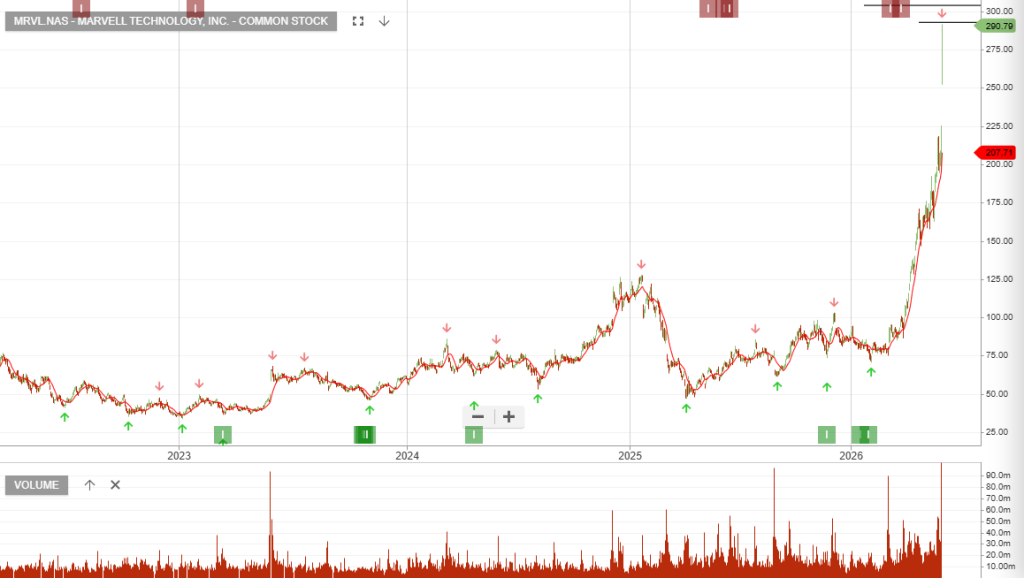
Marvell Technology, Inc. – Common: Noted – Jensen Huang’s high-profile backing of the chipmaker at Computex.
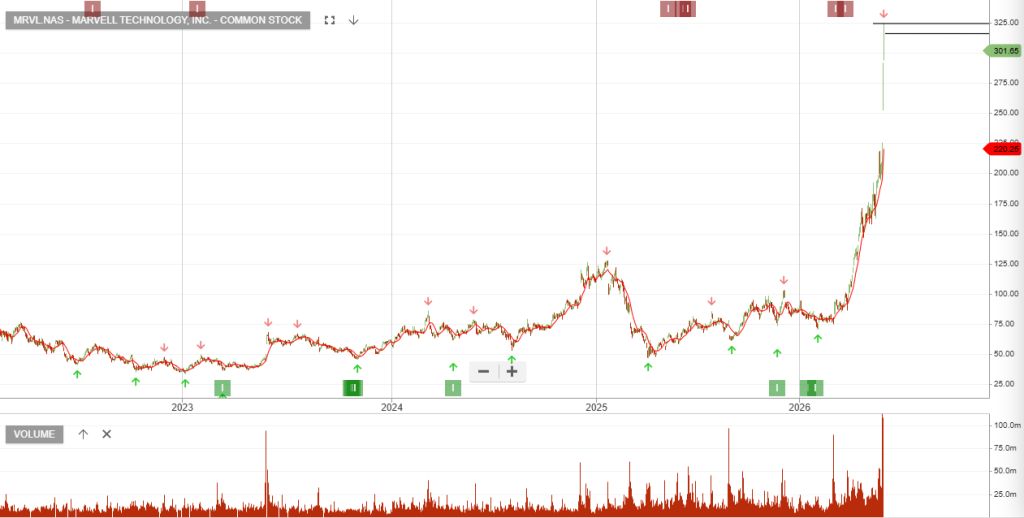
Expected Revenue & Growth: Driven by accelerating AI data center and custom silicon demand, Marvell raised its growth guidance significantly during its last earnings call:
Year-over-Year (YoY) Growth: Represents ~35% YoY growth (beating previous consensus of $2.6 billion).
Sequential Growth: Represents ~12% sequential growth from Q1 FY2027.
YoY Growth: Approximately 40% growth year-over-year.
YoY Growth: Approximately 45% growth compared to
Nvidia CEO Jensen Huang, speaking onstage at Computex in Taipei, called the chipmaker the “next trillion-dollar company,” highlighting Marvell’s critical role in high-speed data center connectivity.
Next Earnings Date: Expected Date: August 20, 2026 (to August 27, 2026)
Following stellar bookings and AI demand, Marvell’s management has significantly upgraded its near-term and long-term revenue projections:
Upcoming Quarter (Q2 FY2027) Guidance: Expected Revenue: $2.70 billion (with a range of +/- 5%).
Growth Rate: Represents ~35% Year-over-Year (YoY) growth
Full-Year FY2027 Guidance: Expected Growth: Projected to grow ~40% YoY to nearly $11.5 billion (strongly upgraded from the previous 30% growth guidance).
FY2028 Guidance: Expected Revenue: Upgraded to $16.5 billion (up from its prior guidance of $15.0 billion).
Expected Profit (EPS) Growth: Profit margins and earnings per share are scaling upward alongside high-margin datacenter optical and custom ASIC programs: Upcoming Quarter (Q2 FY2027) Guidance: Growth Rate: Represents an estimated ~35.8% YoY growth compared to the prior-year period.
Key Growth Drivers
Despite delivering a strong “beat” on both top and bottom lines for the quarter, the stock tumbled in extended trading. This sell-off was primarily driven by mixed Q4 revenue guidance and near-term cautious commentary on hardware costs and sales team transitions.
Q3 FY2026 Financial Highlights (The “Beat”)
Level 17 Chifley Tower
2 Chifley Square
Sydney, NSW 2000
1300 614 002
Investor Signals Pty Ltd
ABN 44 143 555 453