Liontown

Liontown

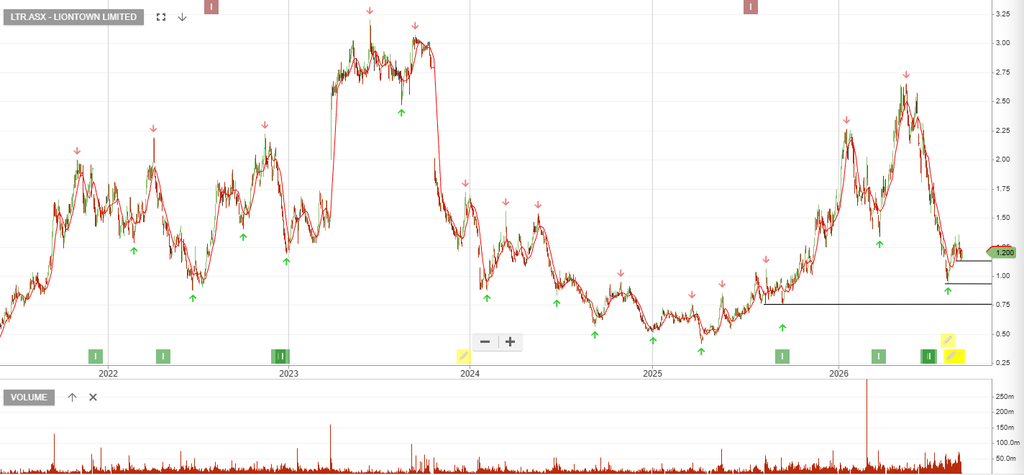
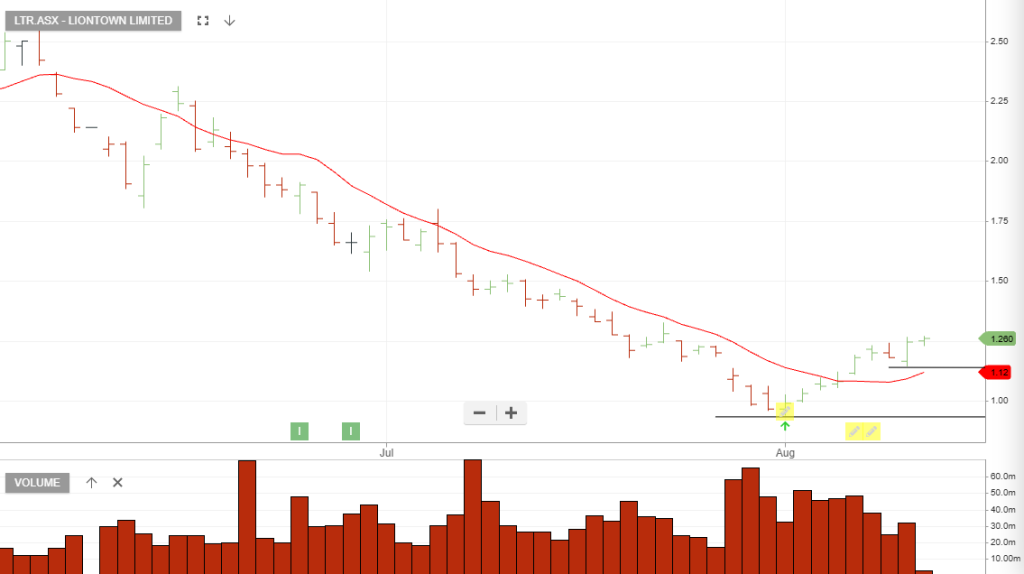
Liontown’s FY26 headline result was weak, but the investment case now hinges much more on FY27 execution and lithium prices than FY26 earnings.

  • FY26 EBITDA disappointed badly: A$147m, around 29% below consensus. The NPAT beat isn’t particularly meaningful because it was driven largely by the A$113m deferred tax asset, rather than better operations.
  • Cash flow is the bright spot: A$182m operating cash flow and A$561m year-end cash materially strengthen the balance sheet.
  • Kathleen Valley is progressing: 392kt concentrate production was within guidance, plant availability reached 92%, and June-quarter recovery improved to 63%.
  • FY27 costs are the major concern: guidance of A$1,050–1,250/t versus FY26’s A$987/t means investors aren’t yet seeing the operating leverage you’d normally expect as production ramps.
  • Capex is substantial: A$320–370m in FY27, and importantly this does not include the full expansion capital associated with the next Kathleen Valley expansion.
  • Next major catalyst: the refreshed feasibility study and FID for expansion beyond 2.8Mtpa, expected by end-September 2026.

Investment view

I wouldn’t put too much weight on the FY26 earnings miss itself. The more important question is whether Kathleen Valley can transition from a capital-intensive ramp-up story into a genuinely low-cost, high-cash-generating lithium operation.

The improving lithium price is helping considerably. If lithium remains strong, LTR’s A$561m cash position gives it substantially more flexibility to fund expansion without putting the balance sheet under immediate pressure. But if the September expansion study reveals significantly higher capital requirements, the market could quickly refocus on funding and returns.

Wesfarmers

Wesfarmers

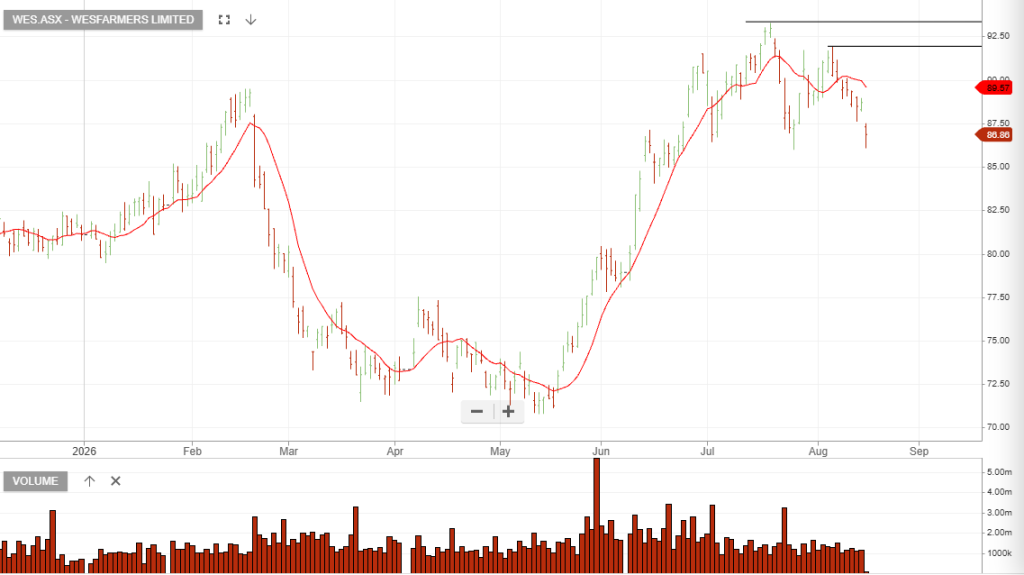
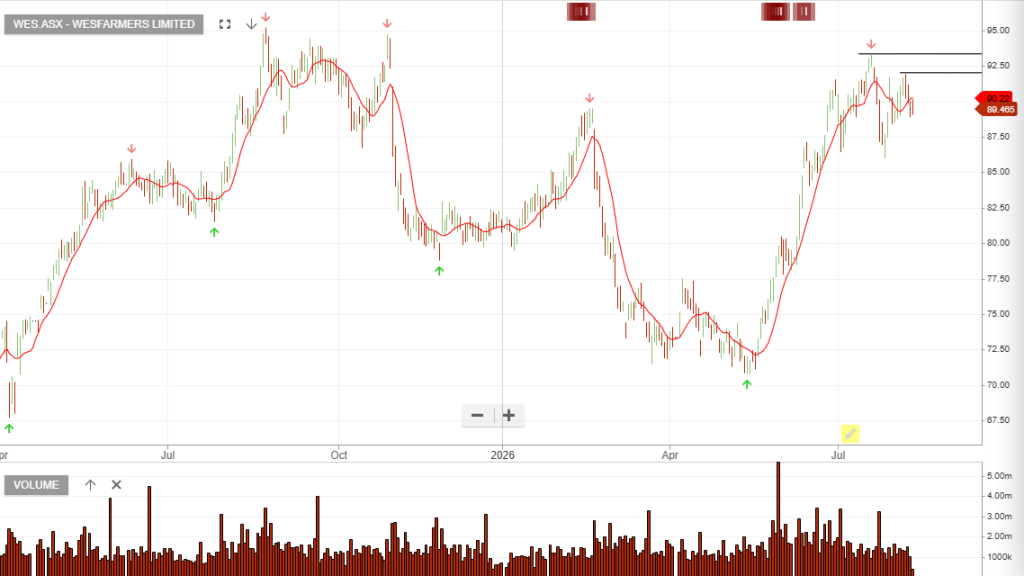
Update 17/8: Hold short position open.

Earnings Date

  • Upcoming Release: Thursday, 27 August 2026 (FY2026 Full-Year Results).
  • Briefing: Live analyst briefing scheduled for 10:00 AM AWST / 12:00 PM AEST.

Expected Revenue & Growth

  • FY26 Revenue Forecast: ~A$47.1 billion.
  • Expected Revenue Growth: ~3.0% – 4.0% YoY.

Macquarie Tech

Macquarie Technology Group

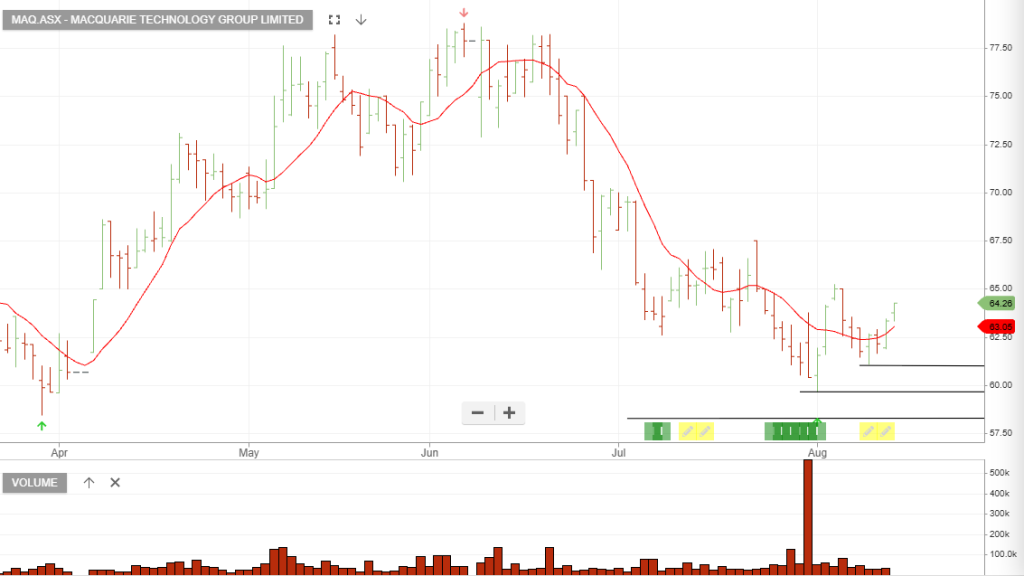
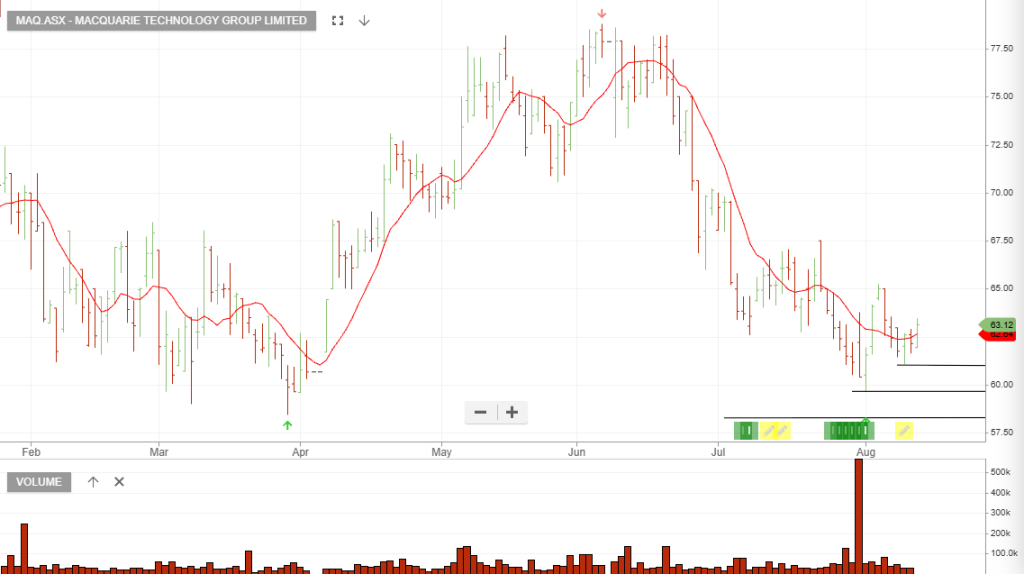
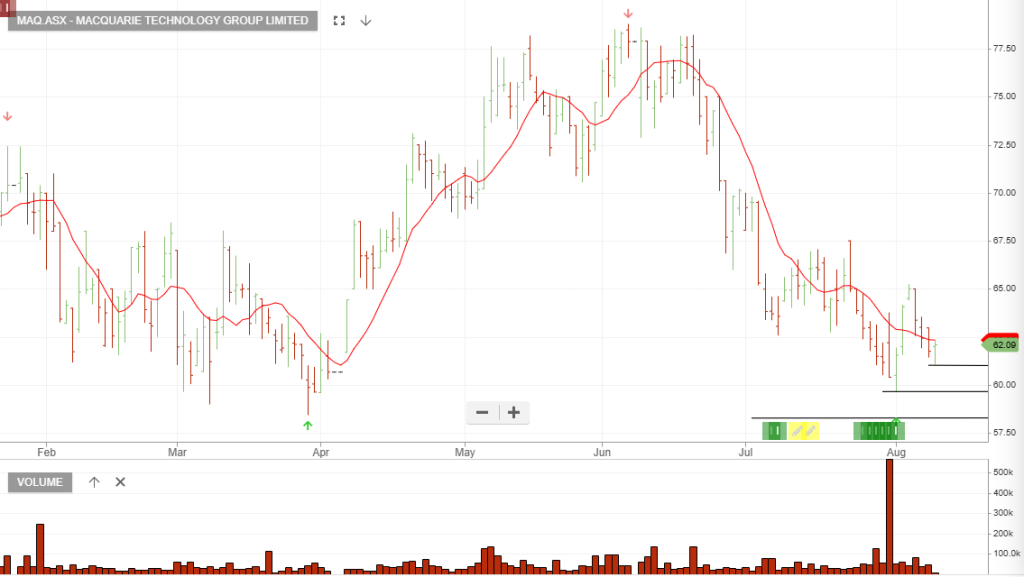
Update 14/8: Buy and place the stop loss at $61.09

Update 13/8: Entry condition triggered, buy with a stop loss at $61.09

Full-Year FY26 Consensus Forecast: Analysts expect full-year FY26 revenue in the range of A$380M – A$390M, representing a year-over-year revenue growth of roughly 3% to 5% compared to FY25

Valuation & Comparative Context

  • Trailing P/E (TTM): ~48.5x – 50.7x (based on recent reported 12-month net profit).
  • Why the Forward P/E expand relative to Trailing: Net profit after tax (NPAT) is temporarily compressed in the near term due to significant growth capital expenditures—specifically heavy ongoing investments into data centre capacity (e.g., IC3 SuperWest) and increased depreciation/financing costs.

EV/EBITDA Multiple: Shares trade at a forward EV/EBITDA of approximately 17.5x – 18.0x, reflecting strong underlying EBITDA cash flow performance relative to net bottom-line profit.

Marvell

Marvell Technology, Inc. – Common

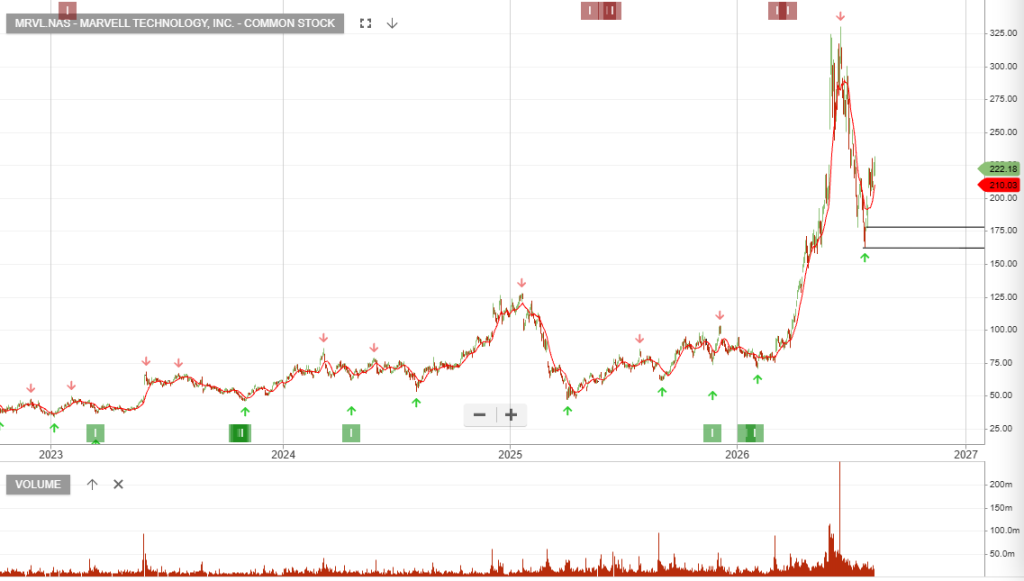
Next Earnings Date: Thursday, August 27, 2026 (After US Market Close / 1:45 PM PT)

  • Reporting Period: Q2 Fiscal Year 2027

Expected Revenue & Growth

  • Consensus Revenue Estimate: ~$2.70B – $2.71B
  • Company Guidance Range: $2.565B – $2.835B (Midpoint: ~$2.70B)
  • Prior Year Comparison (Q2 FY2026): $2.01B
  • Expected YoY Revenue Growth: ~34% to 35% YoY, powered by robust AI data center demand (electro-optics, custom silicon, and switching).

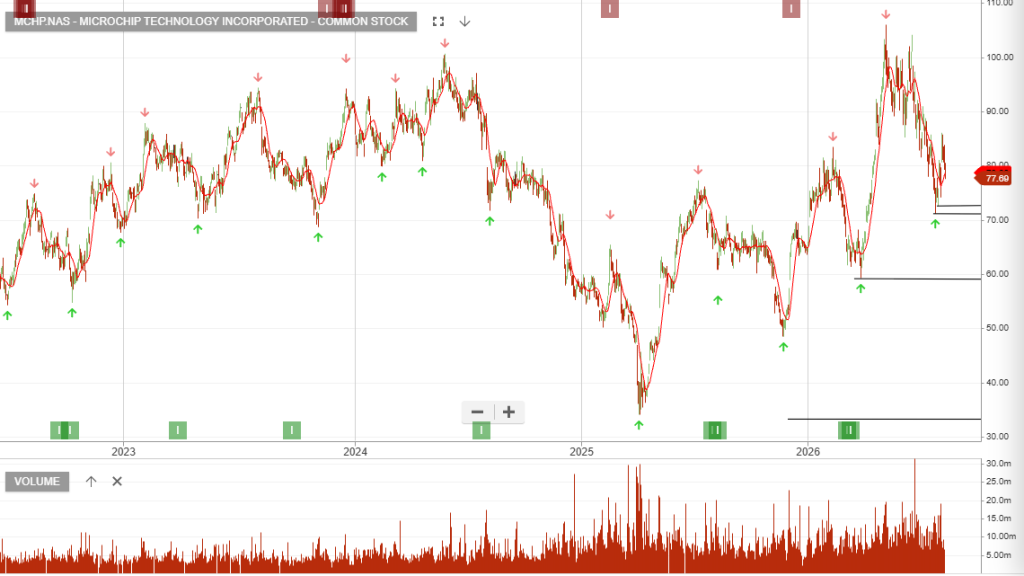
Microchip Tech

Microchip Technology Incorporated – Common

Next Earnings Date

  • Expected Date: November 5, 2026 (after market close)
  • Period: Fiscal Q2 2027 (Quarter ending September 30, 2026)

Expected Revenue & Growth

  • Management Guidance (Q2 FY2027): $1.589 billion to $1.618 billion (midpoint: ~$1.60 billion).
  • Sequential Growth: Up 7.0% to 9.0% quarter-over-quarter.
  • Year-over-Year (YoY) Revenue Growth: Approximately +40.6% YoY (compared to $1.14 billion in Q2 FY2026).
  • Year-over-Year (YoY) EPS Growth: +125% to +165% YoY (up from $0.35 per share in Q2 FY2026).

Coherent

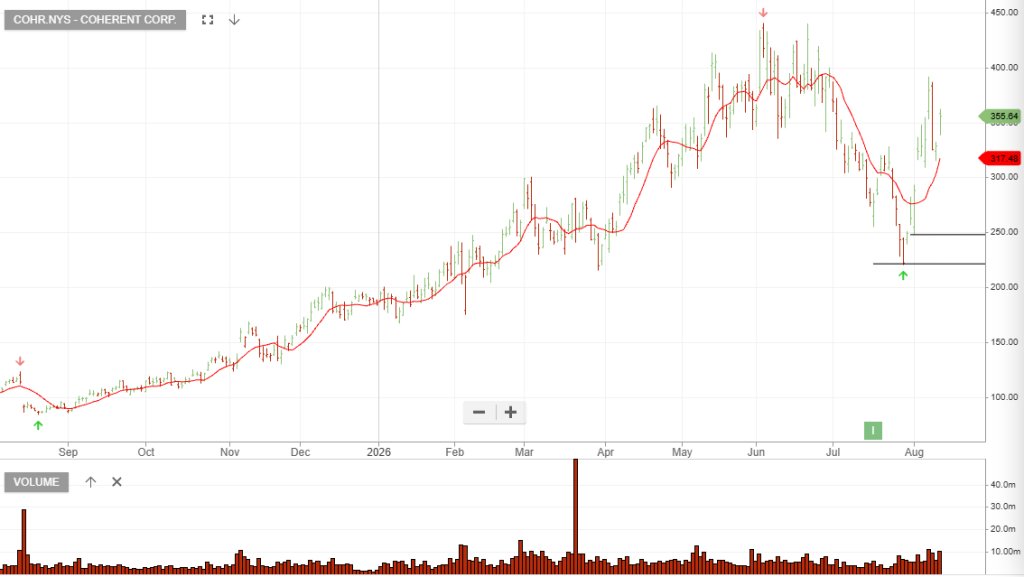
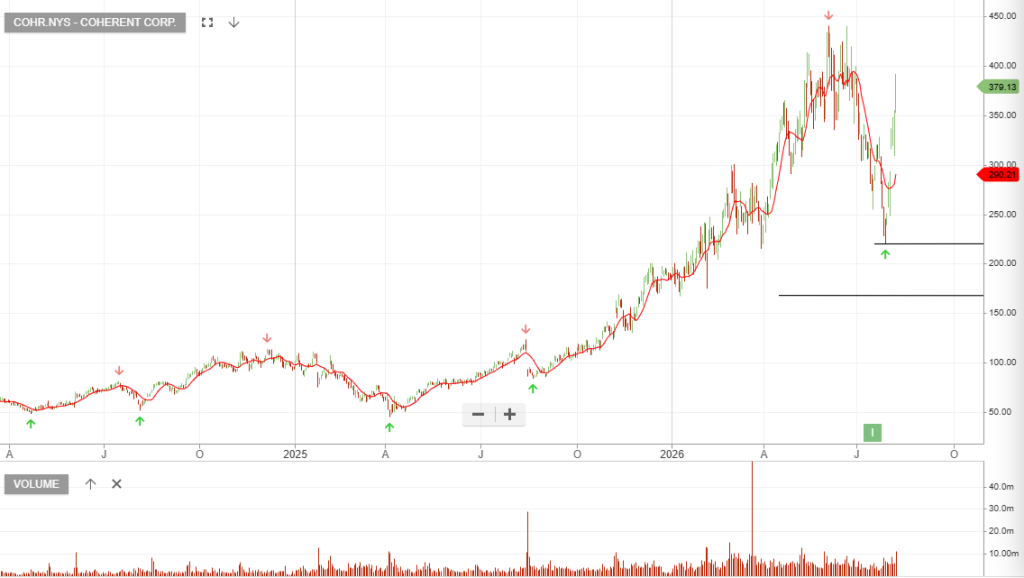
Coherent is under Algo Engine buy conditions.

Update 13/8:

Latest Financial Results Summary (Q4 FY2026 – Reported Aug 12, 2026)

  • Quarterly Revenue: $2.05 Billion (+34% YoY)
  • Quarterly Non-GAAP EPS: $1.74 (+74% YoY)
  • Full-Year FY2026 Revenue: $7.12 Billion (+23% YoY / +28% pro forma)
  • Full-Year FY2026 Non-GAAP EPS: $5.61 (+59% YoY)

Earnings Announcement (Q4 & Full-Year FY2026): Wednesday, August 12, 2026 (Post-market)

strategic equity investment and multi-year supply agreement with NVIDIA, fortifying cash balance ($1.59 Billion in cash/equivalents) to fund capacity expansion.

Q4 FY2026 revenue guidance represents expected year-over-year top-line growth of 24.9% to 34.1%, with the midpoint implying a ~29.5% YoY expansion driven by continued momentum in AI data center optical transceivers.

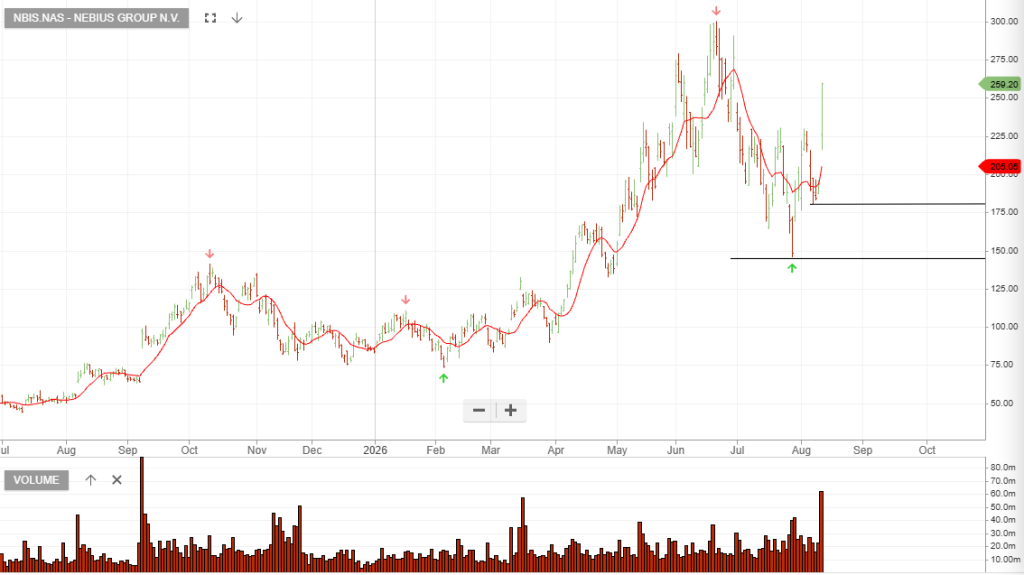
Nebius

Nebius Group

Q2 2026 Earnings Highlights

  • Revenue: $582.3 million, up 454% YoY (beating consensus estimates of ~$573.9 million).
  • Adjusted EBITDA: $236.2 million (41% EBITDA margin), up from a loss of $21.0 million in Q2 2025.

Q3 2026 Analyst Expectations: Consensus Revenue Target: ~$951.55 million.Consensus EPS Estimate: -$1.41 per share (reflecting heavy capital investments into infrastructure buildouts).

    Q4 2026 Analyst Revenue Consensus: ~$1.445 billion.

    Backlog & Contracts: Total contracted backlog stands at approximately $40 billion, backed by multi-year agreements with major hyperscalers.

      Super Micro

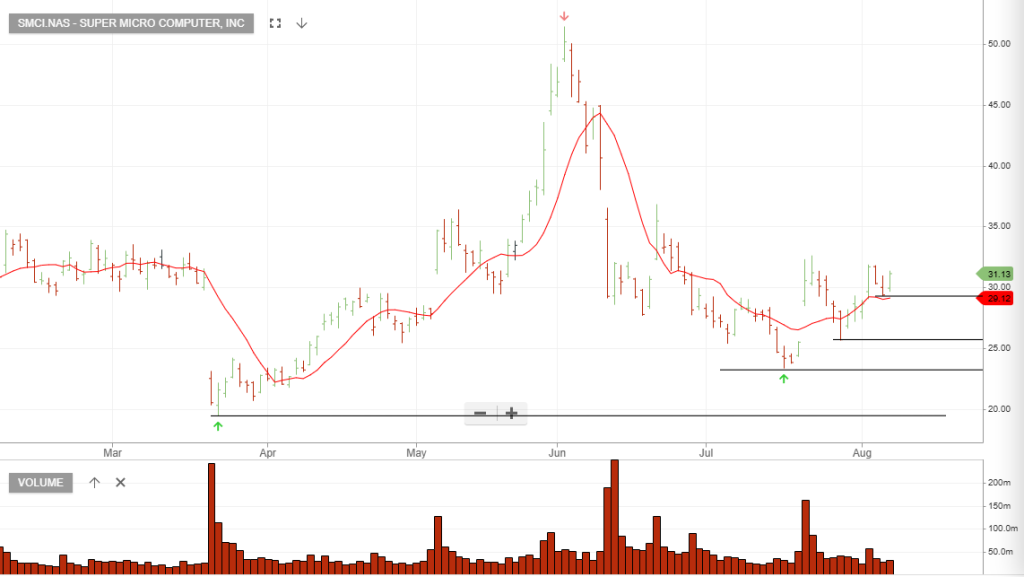
      Super Micro Computer, is rated a buy, with a stop-loss at $29.33

      Update 12/8: Supermicro is stating that they expect their business to expand dramatically—nearly doubling annual revenue from $39.1 billion (achieved in FY2026) to $65.0–$72.0 billion (projected for FY2027).

      Upcoming Earnings Release (Q4 FY2026): Tuesday, August 11, 2026 (After Market Close)

      • Revenue: Expected around $11.0 Billion (representing ~91% YoY growth, at the lower end of management’s $11.0B–$12.5B guidance range due to shipment timing

      Trailing P/E trades around ~16x–17x.

      Liontown

      Liontown is rated a buy, with a stop-loss at $1.14

      Business Activity: Liontown Resources is an Australian tier-one battery minerals producer focused on hard-rock lithium extraction and development. FY26 Full-Year Financial Results: August 31, 2026

      Expected Revenue & Growth

      • Ramp-Up Trajectory: Revenue has scaled rapidly as the Kathleen Valley Lithium Operation progresses through underground development and production ramp-up.

      Looking into FY27, analysts forecast a return to strong bottom-line profitability, with net profit consensus estimated in the range of A$465 million to A$530+ million,

      Macquarie Tech

      Macquarie Technology Group

      Update 13/8: Entry condition triggered, buy with a stop loss at $61.09

      Full-Year FY26 Consensus Forecast: Analysts expect full-year FY26 revenue in the range of A$380M – A$390M, representing a year-over-year revenue growth of roughly 3% to 5% compared to FY25

      Valuation & Comparative Context

      • Trailing P/E (TTM): ~48.5x – 50.7x (based on recent reported 12-month net profit).
      • Why the Forward P/E expand relative to Trailing: Net profit after tax (NPAT) is temporarily compressed in the near term due to significant growth capital expenditures—specifically heavy ongoing investments into data centre capacity (e.g., IC3 SuperWest) and increased depreciation/financing costs.

      EV/EBITDA Multiple: Shares trade at a forward EV/EBITDA of approximately 17.5x – 18.0x, reflecting strong underlying EBITDA cash flow performance relative to net bottom-line profit.