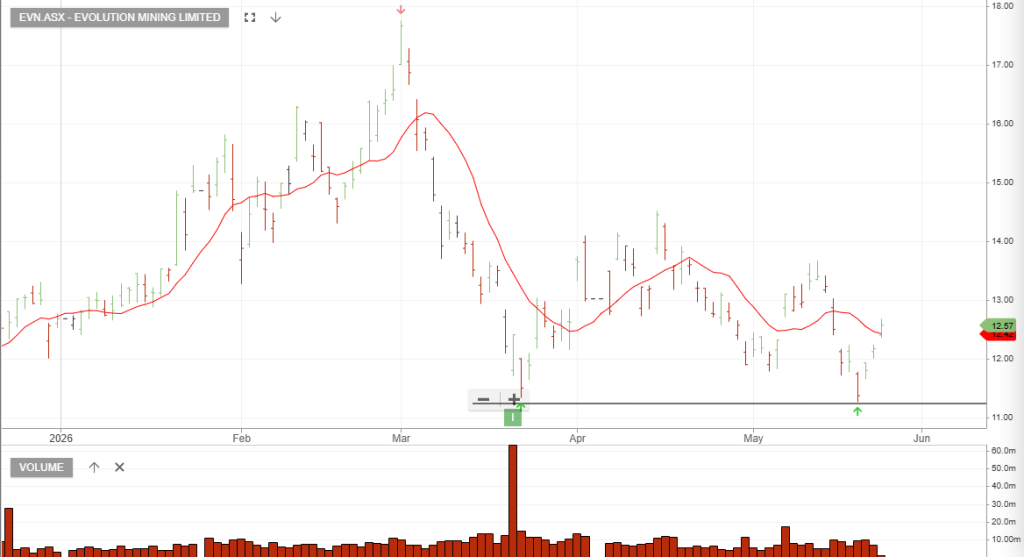
released its H1 FY26 half-year financial results (for the six months ended 31 December 2025) on February 11, 2026, followed by its March 2026 Quarterly Report on April 15, 2026.
The company delivered record-breaking financial performance, driven primarily by soaring commodity prices and disciplined cost management.
Key Financial Highlights (H1 FY26 vs. H1 FY25)
Statutory Net Profit After Tax (NPAT):$766.6 million, up 110% (from $365.1 million in H1 FY25).
Underlying NPAT:$785 million, up 104%.
Revenue:$2.79 billion, up 37% (from $2.03 billion).
Earnings Date: Monday, June 1, 2026 (after market close)
Consensus Estimates:
* Expected Non-GAAP EPS: ~$0.51 to $0.55 (Consensus is around $0.54, representing a substantial year-over-year increase) * Expected Revenue: ~$9.75B – $9.78B
HP shares have been buoyed by strong financial results from Lenovo Group, HP soared over 15.0%, and Dell surged to a fresh historic record high as investors preemptively positioned ahead of earnings next week.
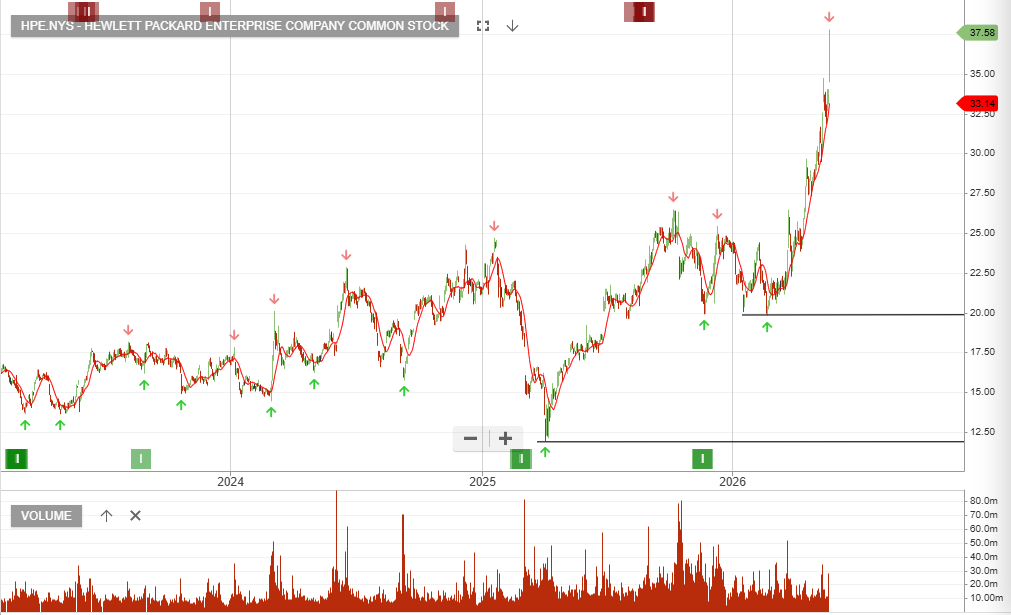
Latest Reported Earnings: Q1 Fiscal 2026 (Reported March 9, 2026) HPE delivered a highly profitable first quarter, notably beating profitability and cash flow expectations, driven by strong networking demand and early synergy capture from the Juniper Networks integration:
Revenue:$9.3 billion, up 18% year-over-year (matching consensus expectations of ~$9.31 billion).
Non-GAAP Diluted EPS:$0.65, beating analyst expectations of $0.59 and exceeding the company’s guidance of $0.57 – $0.61.
GAAP Diluted EPS:$0.31.
Free Cash Flow (FCF):$708 million, up $1.6 billion year-over-year (a strong result as Q1 is seasonally a cash outflow quarter).
Key Segment & Business Highlights
Networking Surge: Revenue in the Networking segment soared 151.5% YoY to $2.7 billion (representing nearly 30% of total revenue). This was driven by WiFi-7 uptake, strong data center switching orders, and the rapid integration of Juniper.
AI Backlog: HPE built up a record $5 billion AI systems backlog, primarily from enterprise and sovereign customers, which is expected to translate into revenue in the second half of fiscal 2026.
Supply Chain Management: The company has been managing industry-wide DRAM and NAND shortages via multi-year supply agreements and agile surcharge pricing.
Raised Fiscal Year 2026 Outlook On the back of the Q1 results, HPE management raised its outlook for the full fiscal year:
FY26 Non-GAAP EPS Guidance: Raised to $2.30 to $2.50 (up from previous guidance).
FY26 Free Cash Flow Guidance: Increased to at least $2.0 billion (up from the previous target of $1.7B – $2.0B).
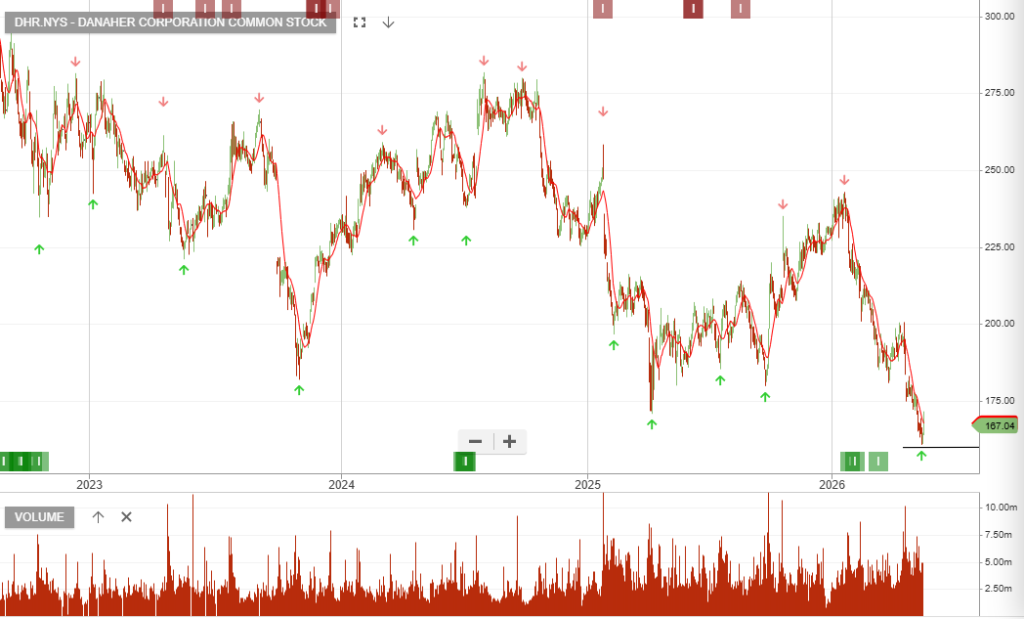
Deep Valuation Discount: DHR has undergone a significant correction, falling roughly 30% year-to-date to trade near its 52-week low of around $161–$163. This pullback has compressed its forward P/E ratio to an attractive 19x–23x range (well below its historical averages) and puts the stock at a steep discount to its estimated DCF intrinsic value of ~$227 per share.
1–3 Year Earnings Growth Outlook
Upward EPS Momentum & Strategic M&A: Following strong Q1 execution, management raised its full-year 2026 adjusted EPS guidance to $8.35–$8.55. Looking out 2 to 3 years, earnings will be further amplified by the integration of Masimo Corporation (a $9.9B acquisition expected to close in H2 2026), where Danaher plans to rapidly scale margins using its signature Danaher Business System (DBS).
Bioprocessing Cycle Rebound: Danaher is in the early stages of a multi-year bioprocessing equipment reinvestment cycle. In Q1 2026, equipment orders surged over 30% year-over-year; as these orders convert to revenue over the next 12 to 36 months, they will drive highly profitable, recurring consumables sales.
Consensus 3-Year Outlook
Steady Compounder: Wall Street consensus model forecasts project a long-term normalized annual revenue growth rate of ~5.5% over the next 1 to 3 years as the life sciences sector fully transitions out of its post-pandemic digestion phase
reported its Q1 2026 financial results on May 5, 2026, delivering a beat on both top and bottom lines as the company continues its transition away from peak pandemic-era revenues. Operational revenue from “launched and acquired products” surged 22%, driven by strong performance in the oncology and specialty care portfolios.
Q1 2026 Earnings Summary
Adjusted EPS: $0.75 (Beat consensus estimate of $0.72 by $0.03).
Total Revenue: $14.45 billion (Beat estimate of ~$13.84 billion; up 5% year-over-year).
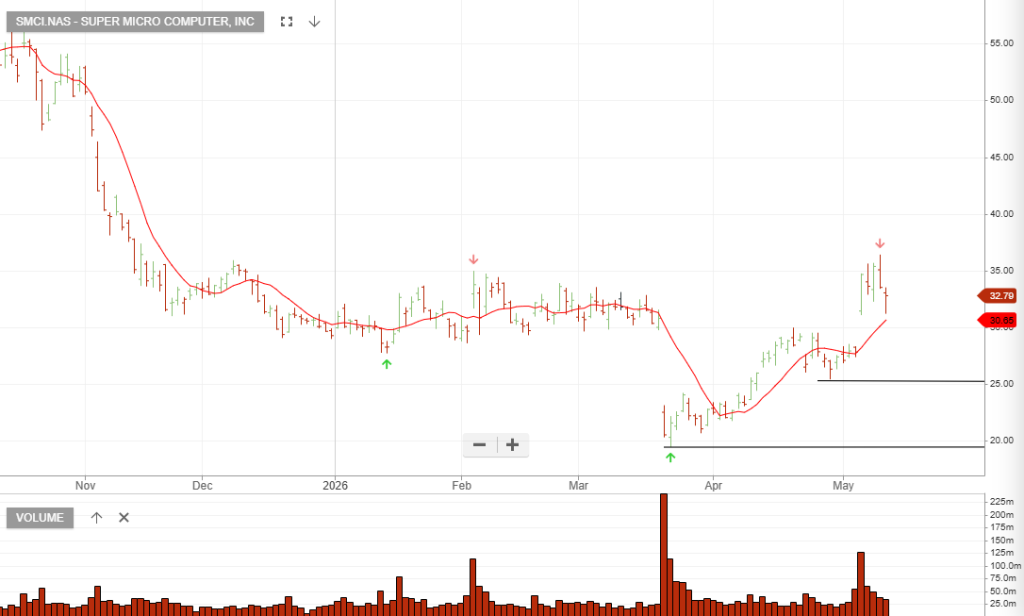
Super Micro Computer, reported its Q3 Fiscal Year 2026 results on May 5, 2026. While the stock saw a massive surge (up ~18-25%) immediately following the announcement, the report was a “beat and miss” that shifted investor focus toward profitability and long-term guidance.
Revenue:$10.24 billion, representing 123% year-over-year growth. However, this missed the analyst estimate of $12.4 billion
Full Year 2026 Revenue: Raised to a range of $38.9 billion to $40.4 billion (up from previous targets of ~$36B).
Key Growth Drivers
AI Infrastructure Dominance: AI GPU-related platforms (NVIDIA, AMD, Intel-based) contributed over 80% of total revenue.
Supply Chain & Deferred Revenue: The revenue miss was attributed to temporary supply chain constraints and “customer readiness” (data centers lacking sufficient power/networking to accept immediate delivery). Management noted a record-high backlog, suggesting that the missed revenue is deferred to future quarters rather than lost.
Direct Liquid Cooling (DLC): SMCI highlighted its leadership in liquid-cooled rack solutions, which are increasingly required for the latest high-power AI chips (like NVIDIA’s Blackwell).
Balance Sheet & Risks
Negative Cash Flow: The company reported negative operating cash flow of $6.6 billion for the quarter, driven by aggressive inventory build-up ($11.1 billion) to support future deliveries.
Leverage: Net debt rose to roughly $7.5 billion as the company utilized convertible notes and credit lines to fund its massive working capital needs.
Legal Overhang: Investors remain cautious regarding an ongoing independent review of export-control matters and a class-action lawsuit (lead plaintiff deadline May 26, 2026), though management stated they do not currently expect a financial restatement.
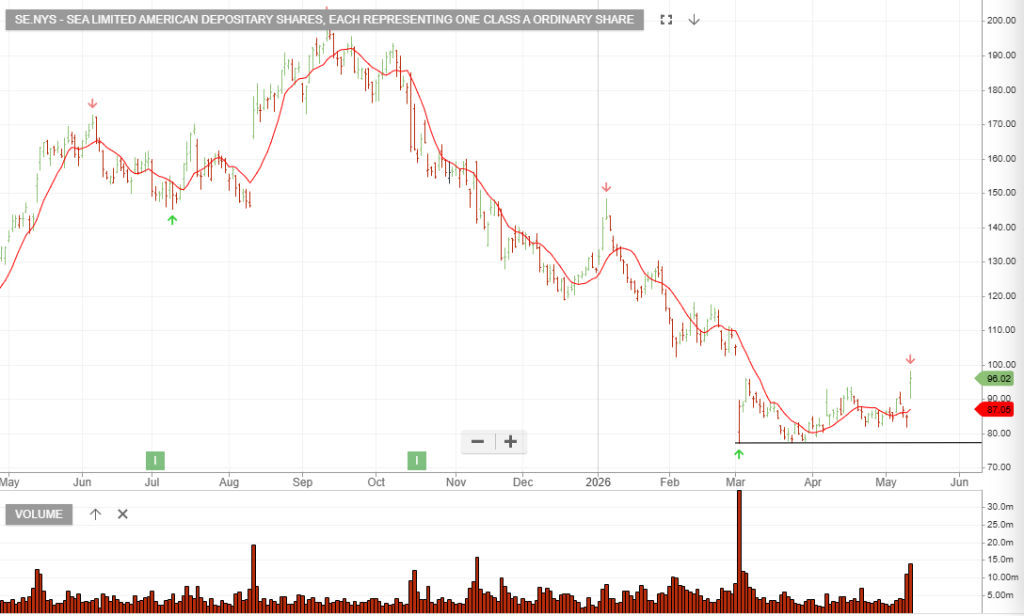
NAS:SEstrong Q1 2026 earnings report, which featured a significant revenue beat and record-breaking performance across its core business segments.
Despite an EPS miss ($0.67 vs. $0.77 expected), investors prioritized the massive top-line growth and evidence that Sea’s strategic investments in logistics and AI are improving unit economics. The company demonstrated its ability to scale rapidly while maintaining financial discipline in a competitive Southeast Asian and Latin American landscape.
Significant Revenue Beat: Sea reported GAAP revenue of $7.1 billion, a 46.6% year-over-year increase, comfortably exceeding the analyst consensus of $6.45 billion.
EBITDA Milestone: The company achieved a quarterly adjusted EBITDA of $1.0 billion for the first time, representing a 9.3% increase.
Shopee Dominance: The e-commerce segment reached record highs with Gross Merchandise Value (GMV) of $37.3 billion (+30.2% YoY) and revenue of $4.5 billion (+44.4% YoY).
Garena Recovery: The gaming division, Garena, delivered its strongest quarter since 2021, with bookings rising 20.1% to $931.4 million, fueled by the continued popularity of Free Fire*.
Fintech Growth: Its digital financial services arm, Monee, saw revenue surge 57.8% to $1.2 billion, with its loan book growing 71% while maintaining stable asset quality.
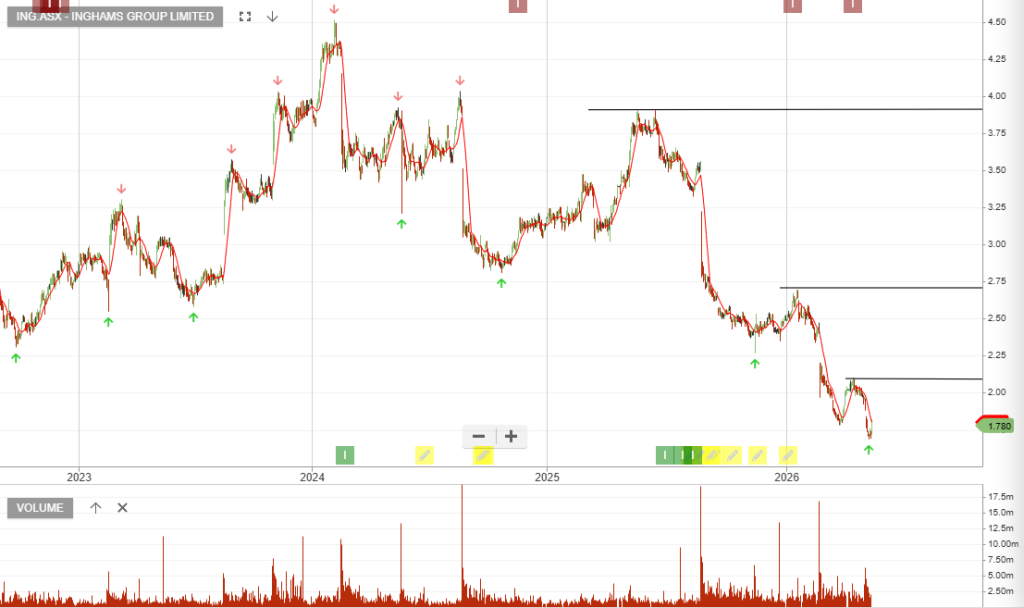
Inghams Group shares rose 6.2% to $1.80 following a trading update that reassured investors about the company’s full-year outlook despite significant external headwinds.
Although Inghams has struggled over the past 12 months (with the share price down over 50% in that period), the market reacted positively to signs of “stabilising” trading conditions and the company’s ability to maintain its earnings forecast despite the spike in diesel and logistics costs.
FY26 Guidance & Financials
EBITDA Reaffirmed: Inghams maintained its FY26 underlying EBITDA (pre-AASB 16) guidance of $180 million to $200 million.
Previous Cut: This guidance had been revised downward in February 2026 (from a previous $215M–$230M range), so the reaffirmation provided the market with much-needed stability.
Operational Momentum: For the first nine months of FY26, group poultry volumes rose 1.1%, and net selling prices also increased by 1.1% compared to the prior corresponding period (PCP).
Strategic & Defensive Measures To protect its margins against fuel and packaging inflation, Inghams is executing several key initiatives:
Cost-Cutting Program: Targeting $60 million to $80 million in annualised savings.
Inventory Management: Reduced frozen inventory by $25 million, improving cash flow and system balance.
Capital Expenditure: Revised FY26 CapEx guidance to approximately $80 million.
Sophisticated Investor?
We have special opportunities available for Sophisticated Investors. If you're interested, and qualify, please provide your details below.