Global Macro: Strong Trends Into Year End

Political events and Central Bank policy moves have been driving global financial markets over the last two months. During this time, direct influence from weekly economic data seems to have diminished. With dealing desks starting to thin and investors looking to the holidays, this is likely to remain the case over the next two weeks.

But even as financial markets slip into holiday mode, there are several powerful trends that are worth watching. Three of these trends have been particularly vigorous: The USD climb against the JPY, the rise in the US 10-year yields, and the rally in the SP 500 have all been very robust. In fact, these three markets have risen six weeks in a row and finished higher over nine of the last 11 weeks. Similarly, the USD Index and US 2-year yields have risen, while Gold has fallen, in seven of the last 11 week.

The key issue now is whether these trends will be extended, or if a profit taking phase will be seen into the end of the year. Arguments that these trends have gone too far too fast are now several weeks old. And even though technical readings are even more overstretched, there aren’t reliable fundamental arguments for taking aggressive positions in the opposite direction……….not yet, anyway.

The basic psychology of these recent trends suggests the new US administration will act swiftly to enact a comprehensive (fiscal) stimulus package; which will allow US stock valuations to expand and the US Dollar to appreciate vis-a-vis higher domestic interest rates.

On balance, we expect the current trends of higher US stocks, firm US Dollar and a steepening yield curve to continue, even as market flows edge into holiday mode.

Dow Jones

Gold: A Corrective Bounce

Gold has found initial support at the $1120.00 level and has posted a corrective move higher over the last two days.

The yellow metal is now approaching the technical downtrend line near $1155.00, which we feel will offer stiff resistance. The 30-day moving average is currently at $1186.00. The RSI has been in oversold territory below the 30.00 mark for over a month, so some price consolidation is expected before extending lower.

Newcrest Mining is currently 3.5% higher at 17.40. We view this move as corrective and would expect sellers to return at , or around, the 18.60 level.

Chart - NCM
Chart – NCM

Global Macro

The US Dollar Index has rallied to its strongest level in more than 13 years as the market continues to digest the ramifications of the FED’s more aggressive interest rate policy trajectory.

Financial markets weren’t surprised when the FOMC announced an increase to the Fed Funds target from .50% to .75%. The move had been widely expected since the October meeting and the FED funds futures had been pricing in a 100% percent certainty of the move.

However, financial markets were not expecting the FED’s “dot plots” to reflect expectations of at least three more rate moves during 2017. Since Wednesday’s announcement, we have seen the EUR/USD trade back below the 1.0400 level and the USD/JPY break the 118.50 level for the first time since February.

It’s important to remember that with a stronger USD comes headaches for other Central banks around the world who will incur a higher cost of servicing USD denominated debt. The stronger USD also poses a risk for the US economy especially in an environment of rising US finance costs.

In short, if the new administration doesn’t come up with a viable stimulus package quickly, the US economic growth story could fade. This could translate into a significant correction in US Stocks, US Treasury rates and the Greenback.

However,  before hitting the sell button on long US asset trades, it is important to realize that for the dollar rally to end, dollar bulls need a reason other than year end profit taking to give up on their trades. The latest round of economic reports continues to support the bullish move in the US Dollar.

Despite a stronger USD, manufacturing activity in the NY and Philadelphia regions accelerated. Consumer prices also grew 0.2%, which was in line with expectations and jobless claims dropped to 254K from 255K. The NAHB housing market index jumped to its highest level in 11 years.

The stronger USD over the last month should have softened these data: weakened the trade figures, manufacturing activity and made it more difficult for the Fed to achieve its inflation target, but we need to see evidence of that before selling the USD and US Stocks.

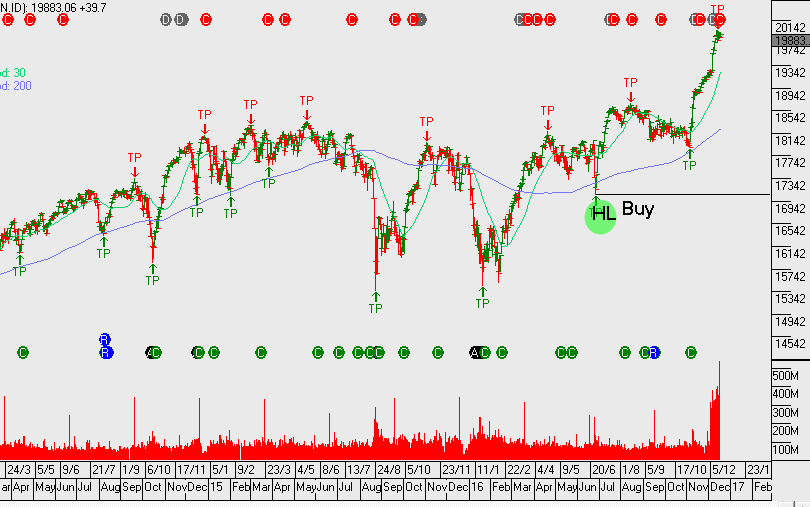
In the meantime, US assets remain in a strong uptrend targeting 20,000 in the DJ 30 and a move in the direction of parity for the EUR/USD.

Incitec Pivot Ltd

Shares of Incitec Pivot posted a 10 month high of $3.55 last Friday, and could test chart resistance near the $4.00 mark in the near-term.

The highlight for the chemical firm has been the early success at their their new ammonia plant in Louisiana.

The new facility, which came in below the US$ 850 million budget, has scaled-up to over 80% capacity utilization with nearly 72kt short tons produced between October and November.

We like IPL, as a firm, and the growth potential of the chemical sector into 2017. As such, we will put IPL on our ALGO radar and look to buy on a dip back into the $3.10 support area.