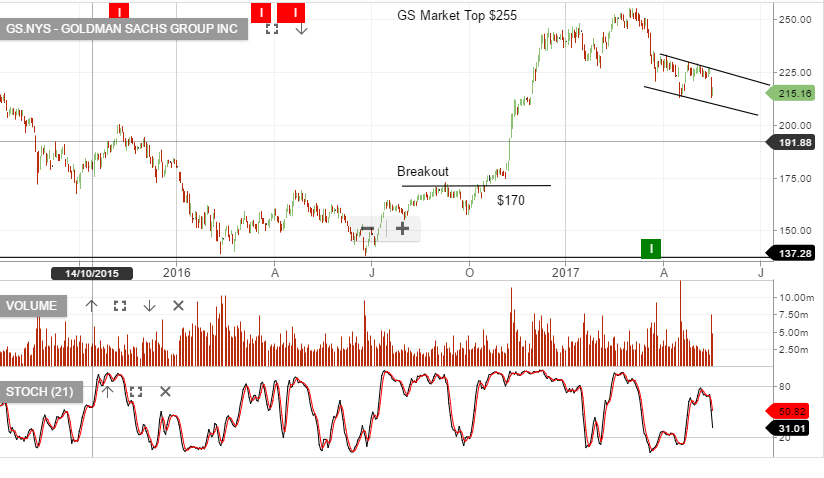
Goldman Sachs has sold off $40 since the high created on the 1st of March. The chart image below shows price action is now finding minor support within a weakening short-term channel.
We’ll continue to watch the chart pattern unfold with anticipated resistance back up at $230.
The relevance of tracking GS for local investors, is it may provide an indication as to when our local banking & finance stocks will find new selling pressure, should they have a minor bounce from yesterday’s lows.