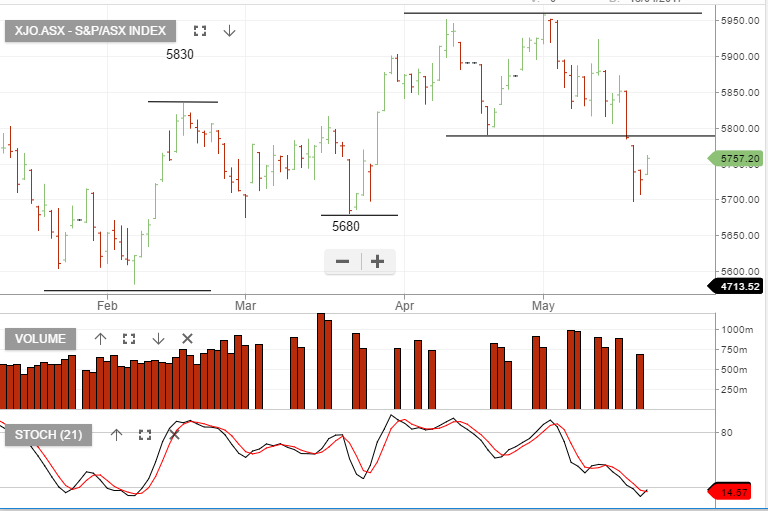
The XJO chart is showing the first lower low structure we’ve seen for some time.
The broader trend, which has been in place since February 2016 is likely in the early stages of breaking lower. Any bounce higher from last week’s selling, is likely to be limited and investors should look to protect their portfolios.
New selling will likely occur within the range of 5790 and 5850, creating a lower high formation as a strong sell side signal.