fbpx

Chart Watch – XJO

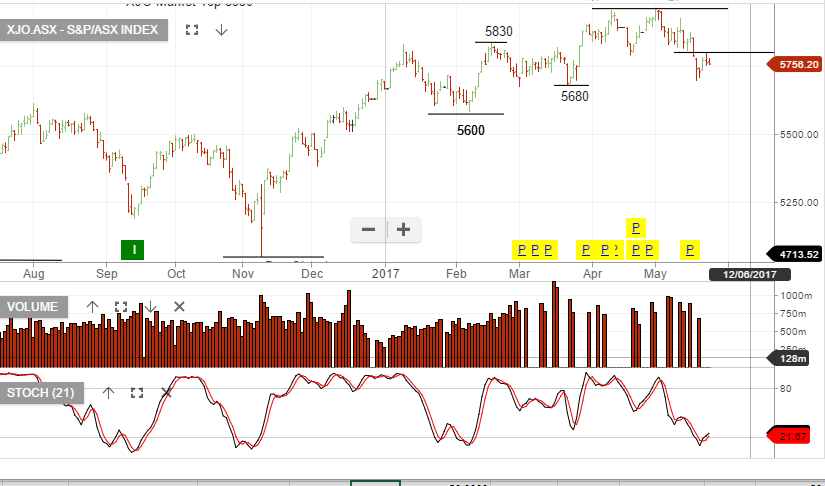
As an update to our recent Chart Watch on the XJO, we highlight again the lower high structure that has now formed. We were expecting a bounce into the 5790 – 5850 level before further selling pressure. Yesterday the price action hit resistance at 5796 and today’s open looks weak against a  positive lead from the US.

Chart – XJO

.

You're not a member!  Trial today


Leave a Reply

Investor Signals Pty Ltd ABN 44 143 555 453 is a Corporate Authorised Representative CAR No. 439411 of Advisor Plus Pty Ltd AFSL 474520
© 2024 Investor Signals

Send our ASX Research to your Inbox

Or start a free thirty day trial for our full service, which includes our ASX Research.