fbpx

Chart Update – XJO

The S&P/ASX 200 Index finished the week up 0.31%

The best performer was the Utilities sector, up 3.6% and the worst performer was the Financials ex-Property sector, down 1.1%. 

You're not a member!  Trial today

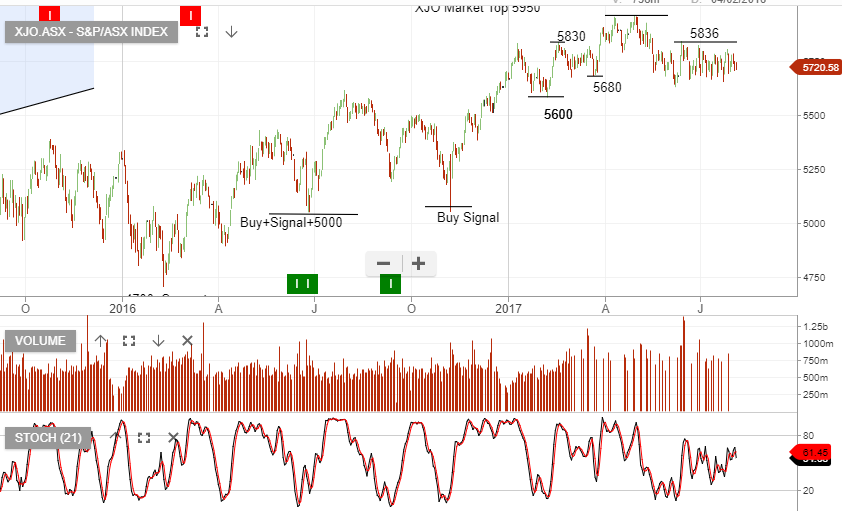
The XJO remains in a “lower high” pattern, as illustrated on the chart below.

Chart – XJO

Leave a Reply

Investor Signals Pty Ltd ABN 44 143 555 453 is a Corporate Authorised Representative CAR No. 439411 of Advisor Plus Pty Ltd AFSL 474520
© 2024 Investor Signals

Send our ASX Research to your Inbox

Or start a free thirty day trial for our full service, which includes our ASX Research.