fbpx

Chart Watch – XJO

We continue to watch the XJO consolidate in a tight band that has been in place since May this year.

This chart pattern is known as a “pennant”  formation.

You're not a member!  Trial today

The chart below illustrates the lower high formation and the likelihood of a break to the downside.
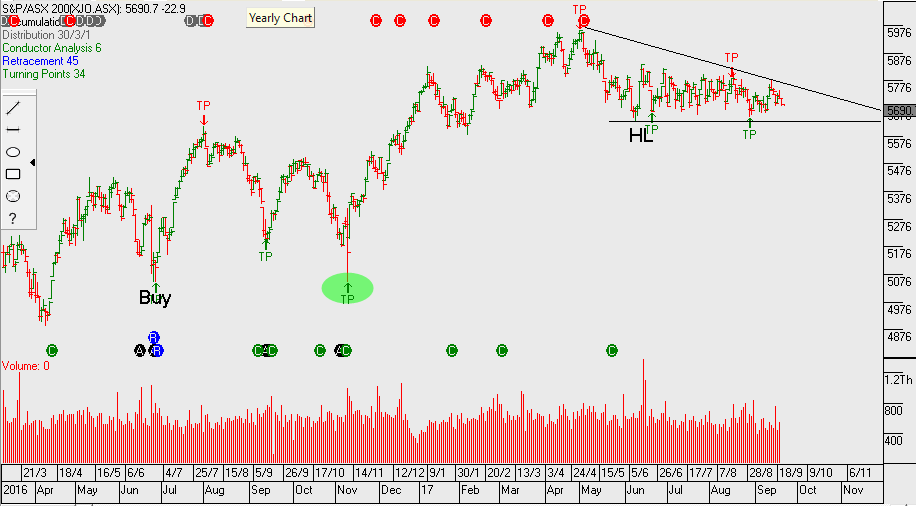
XJO


Leave a Reply

Investor Signals Pty Ltd ABN 44 143 555 453 is a Corporate Authorised Representative CAR No. 439411 of Advisor Plus Pty Ltd AFSL 474520
© 2024 Investor Signals

Send our ASX Research to your Inbox

Or start a free thirty day trial for our full service, which includes our ASX Research.