The XJO 200 Index continues to trade within a broad, sideways “Flag” pattern bound by the June 8th low of 5624 and the June 15th high of 5834.
The low price for the week at 5637 was the result of weakness in the banking names, as well as, a drop in major miners BHP and RIO; which lost 2% and 1.5% for the week, respectively.
The continuation of the “lower high” price pattern suggests a downward bias with the next key support level near the February low of 5578.
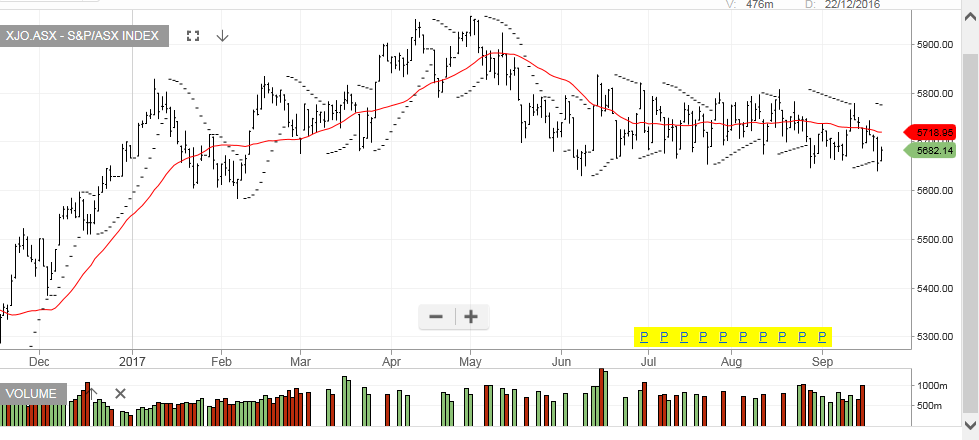 ASX XJO Index