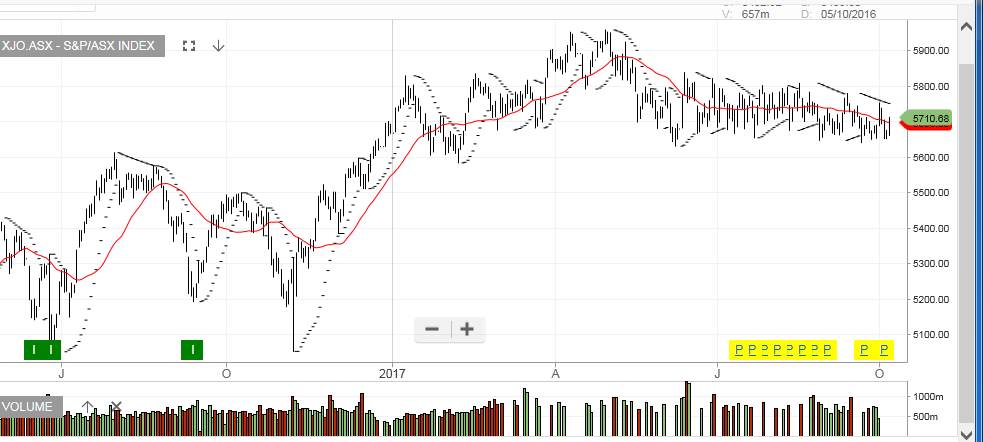
Trading in the XJO 200 Index posted another week within the sideways “Flag” pattern bounded by the June 15th high of 5834 and the June 8th low of 5637.
It’s worth noting that 4 of the 5 trading sessions last week saw intra-day net changes of almost 1% from open to close (2 days higher, 2 days lower).
This increase in daily price volatility suggests a resolution to this 4-month indecision pattern may occur sooner, as opposed to later.
With the series of “lower highs” since the August high of 5810 still the dominant technical component, we believe the break will point to the downside with the next support level near 5570.
 XJO 200 Index