fbpx

XJO – Resistance Levels

The XJO chart displays the recent pattern of negative price reversals.

The latest reversal in today’s trading session, created a “lower high” at 5982.

You're not a member!  Trial today

Technical traders will be leaning on the short-side of the market,  until the index trades back through the 5982 resistance.
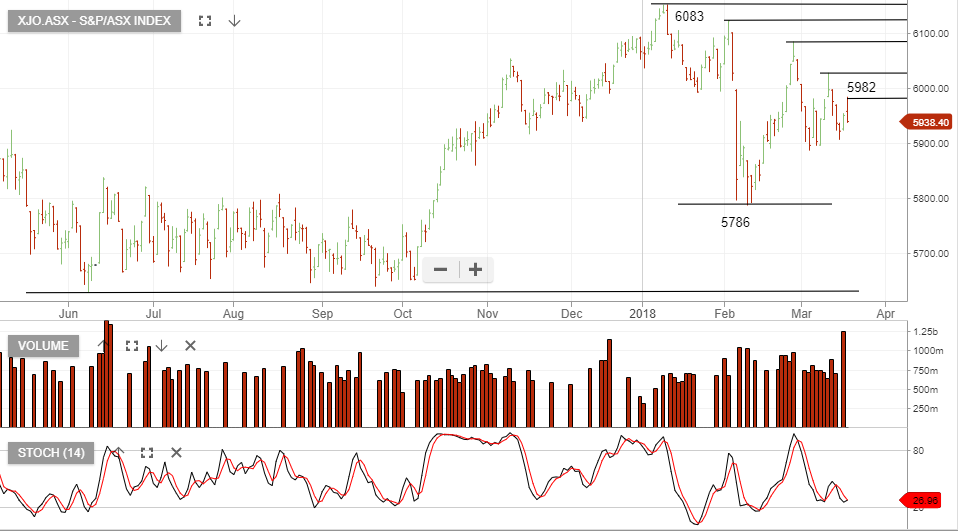
 

XJO Index

Leave a Reply

Investor Signals Pty Ltd ABN 44 143 555 453 is a Corporate Authorised Representative CAR No. 439411 of Advisor Plus Pty Ltd AFSL 474520
© 2024 Investor Signals

Send our ASX Research to your Inbox

Or start a free thirty day trial for our full service, which includes our ASX Research.