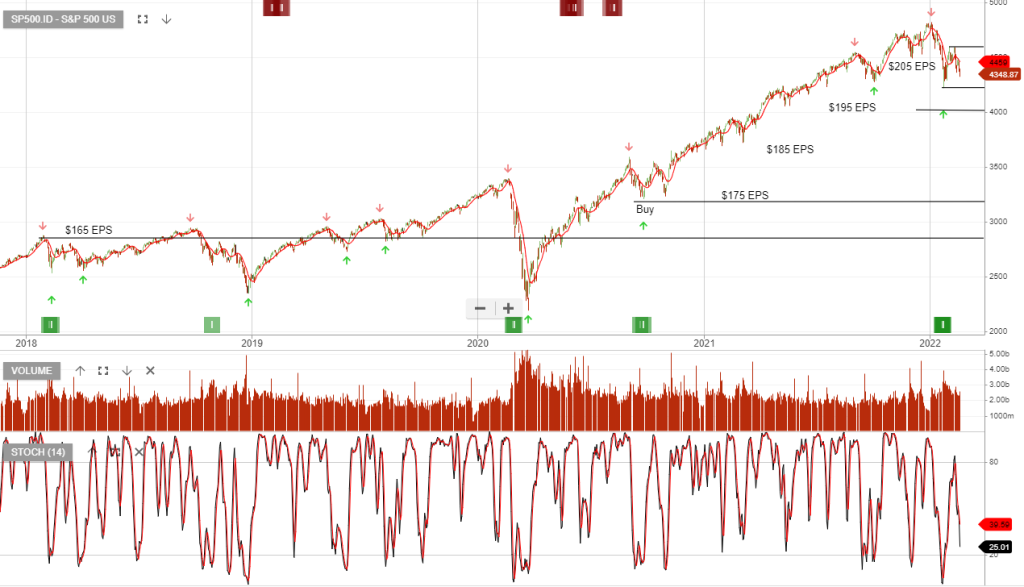
The graph of the S&P500 shows faltering short-term momentum with overhead resistance at 4590 in the S&P500 index.
Join Monday night’s webinar, where I’ll provide detail on the technical patterns that traders and investors should be watching.
Free trial: https://www.investorsignals.com/register
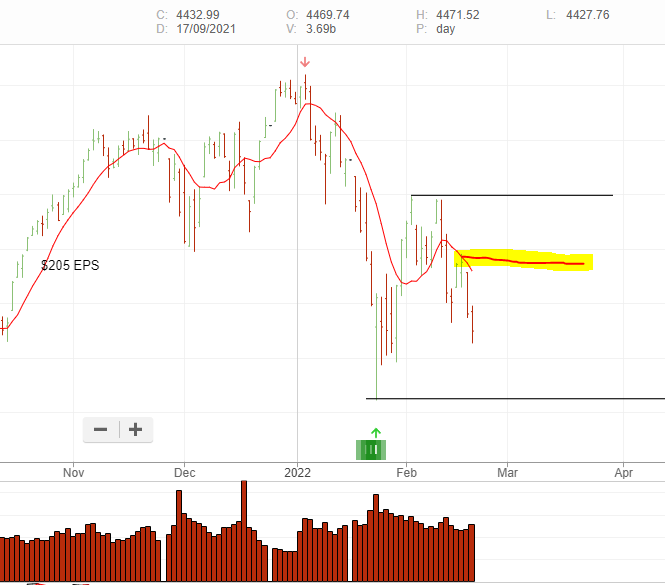
Traders will be monitoring next week’s price action based on the above pattern.
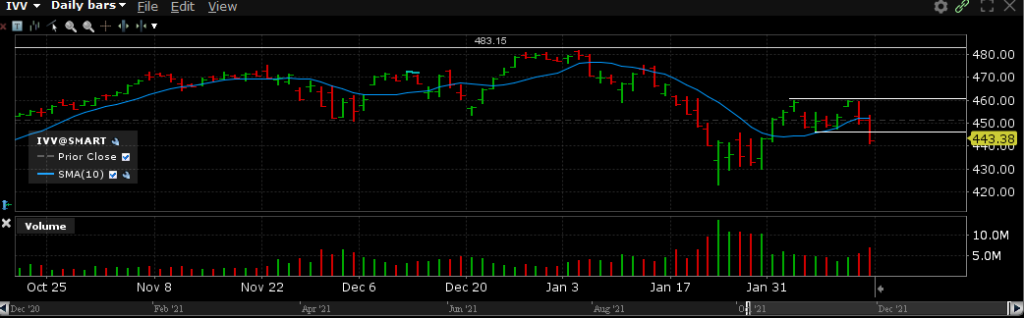
19/2 update: The S&P500 remains below the 10-day average.