Newcrest Mining Profits Jump 22%
Australia’s biggest gold miner, Newcrest Mining, has recorded a full year underlying profit of $394 million, a 22 per cent jump on the previous year.
The strong rise in profit still missed analysts expectations of around $434 million, which has seen the share price slip to $21.65 in early trade.
The company will pay a final dividend of US7.5 cents per share (70 per cent franked) – for a full year dividend of US15 cents.
Further, NCM outlined a new policy under which the company’s dividend payout would be at least 10-30 per cent of that financial year’s free cash flow.
In a statement to the ASX, Newcrest said that under the new policy, the dividend would be “no less than US 15 cents per share on a full year basis”.
Newcrest said its healthy profit came from gold production of 2.38 million ounces, at a “Group All-In Sustaining Cost” of $787 per ounce.
The gold producer recorded free cash flow of $739 million, and reduced net debt by 29 per cent to $1.5 billion.
We maintain an upside bias to NCM and look for rising Spot Gold prices to lift the share price into the $22.60 area over the near-term.
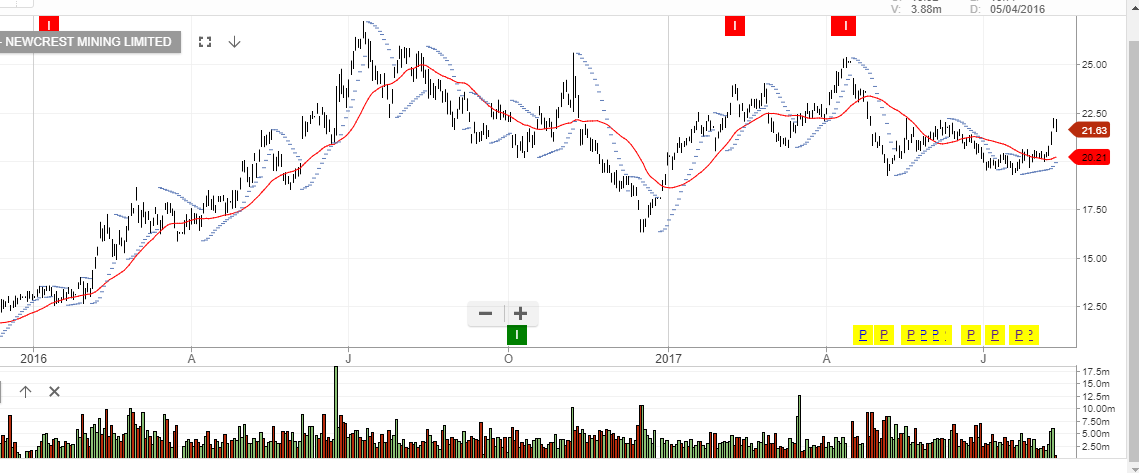
Newcrest Mining
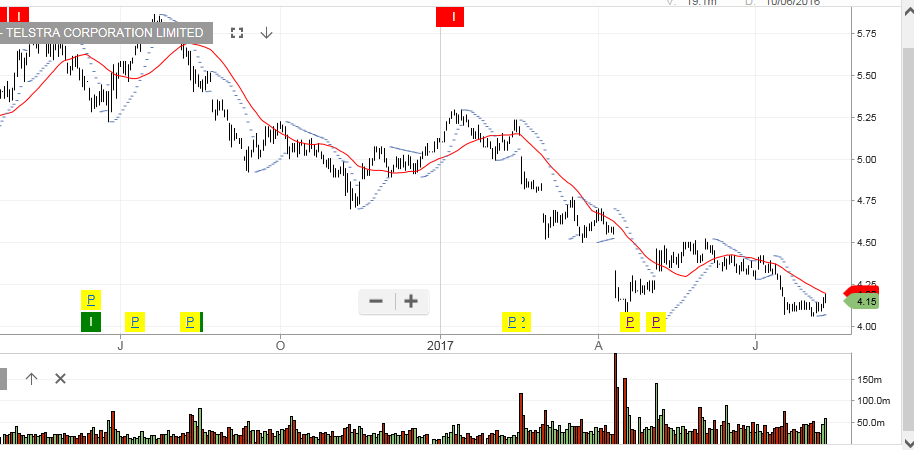 Telstra
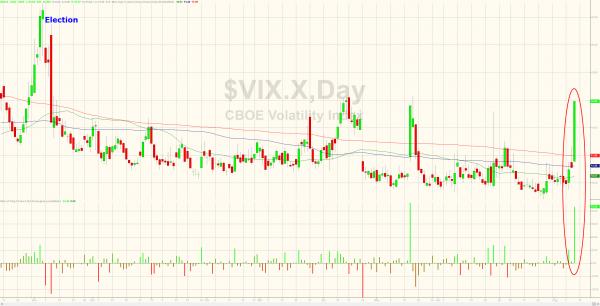 VIX Volatility Index
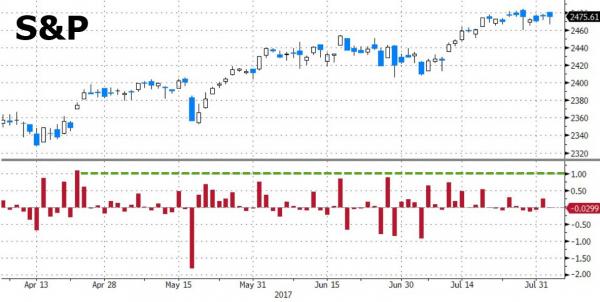
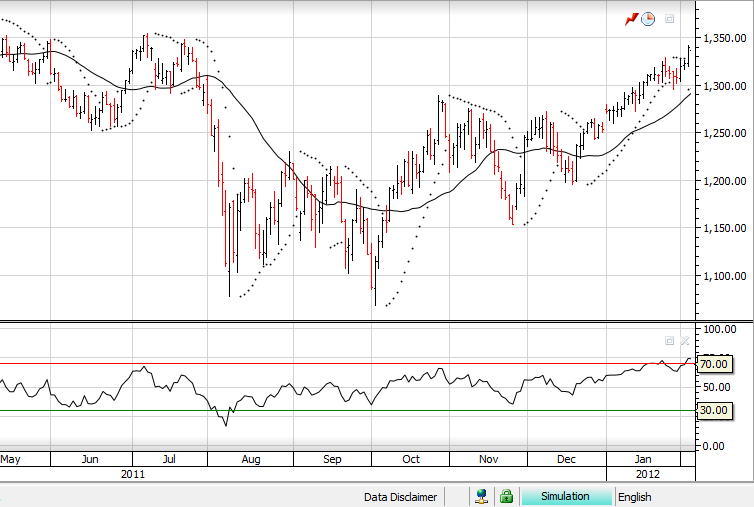
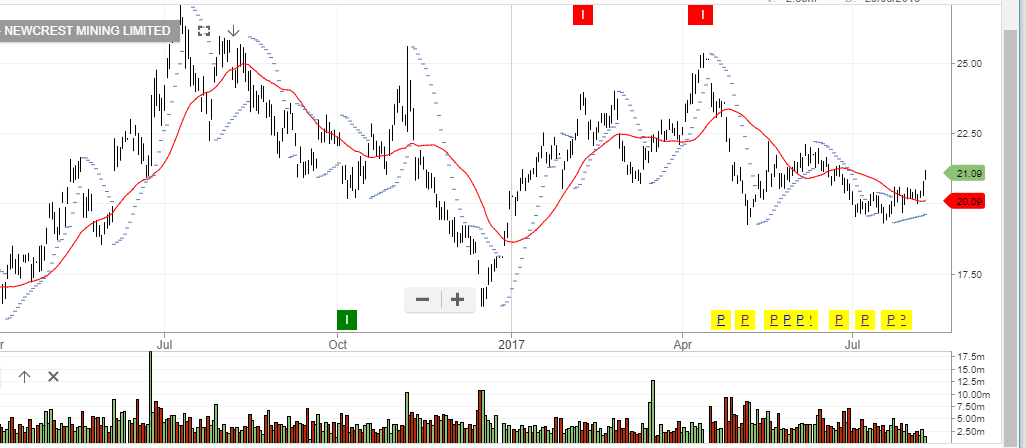
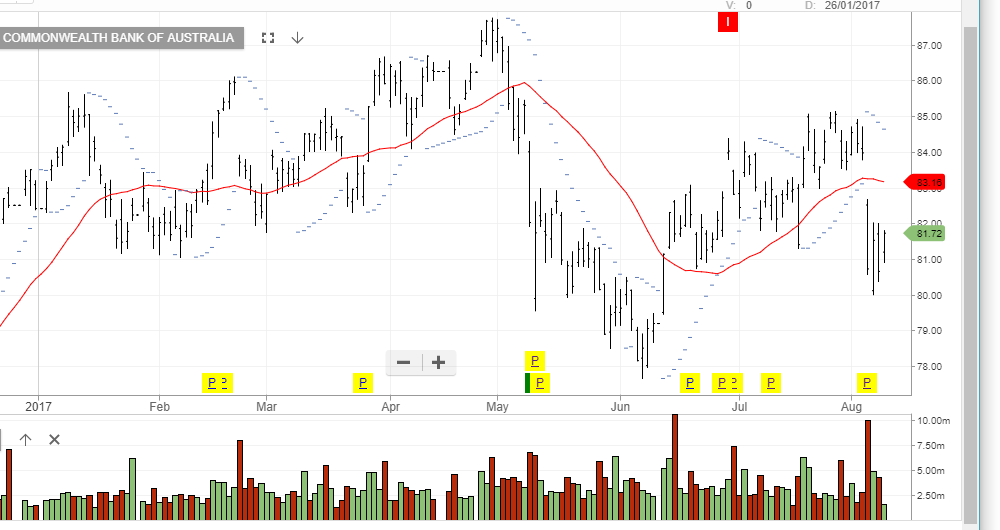 Commonwealth Bank
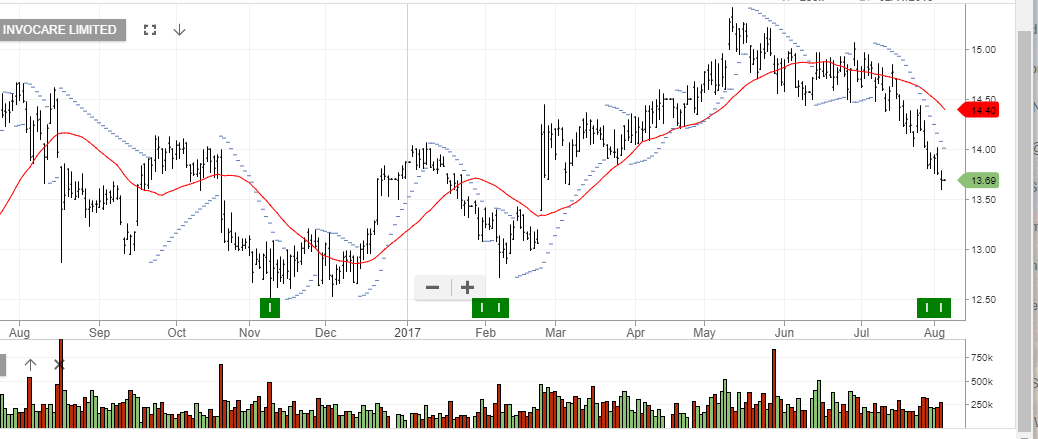 InvoCare
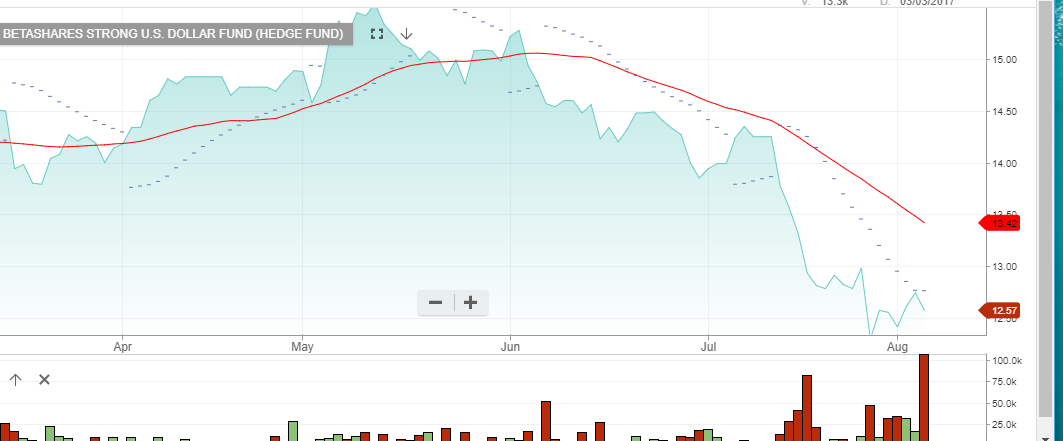
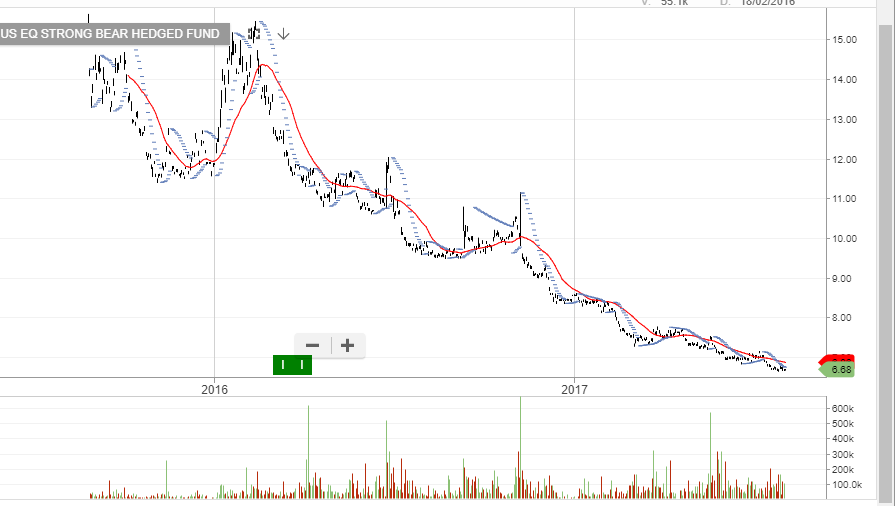 BBUS
BBUS