Aristocrat – 1H17 Earnings

Aristocrat Leisure released 1H17 results with revenue and net profit beating analysts’ bullish expectations. Full year guidance was reiterated with profit growth likely to be + 20-30%.

North America and Digital underpin a strong earnings outlook and the company’s strong balance sheet, will likely see excess capital returned to shareholders and/or new acquisitions announced.

The company declared a dividend of $0.14 for the half-year, which was up from $0.10 in 1H16.

FY18 revenue is likely to increase 10%+ to $2.7b, EBIT $900m on EPS of $0.90, DPS of $0.36, placing the stock on a forward yield of 1.8%.

Our Algo Engine last generated a buy signal in October 2016 at $15.00
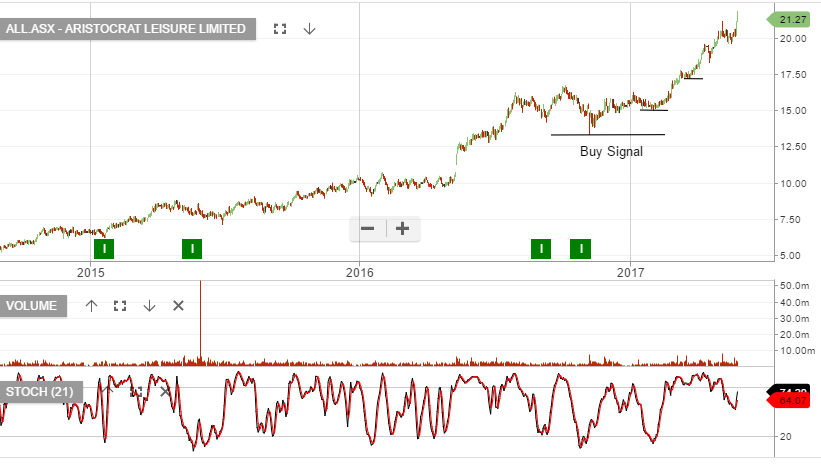
Chart – ALL


Chart Watch – XJO

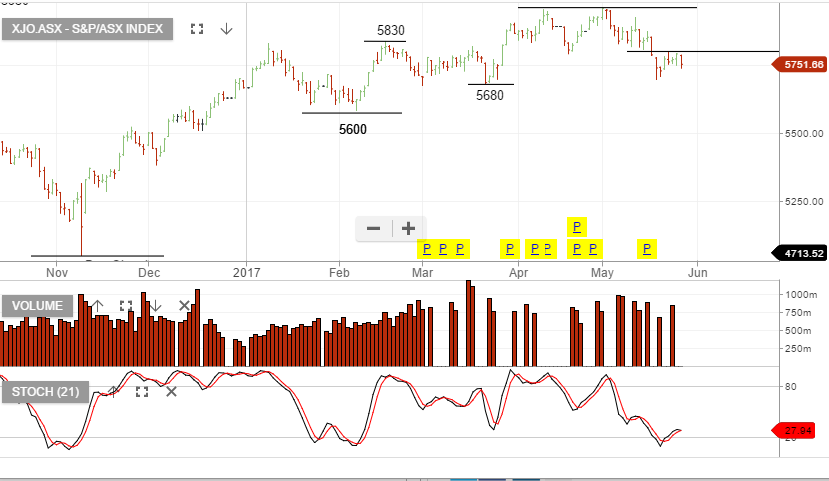
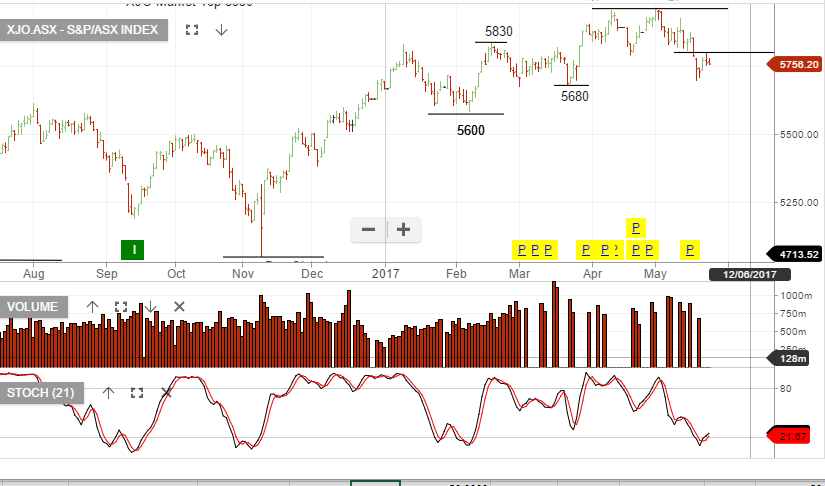
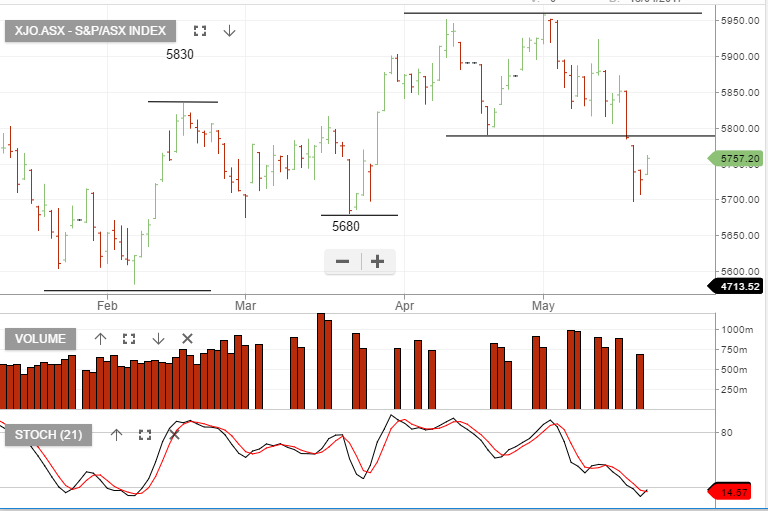
As an update to our recent Chart Watch on the XJO, we highlight again the lower high structure that has now formed. We were expecting a bounce into the 5790 – 5850 level before further selling pressure. Yesterday the price action hit resistance at 5796 and today’s open looks weak against a  positive lead from the US.

Chart – XJO

.


Boral -FY18 Outlook

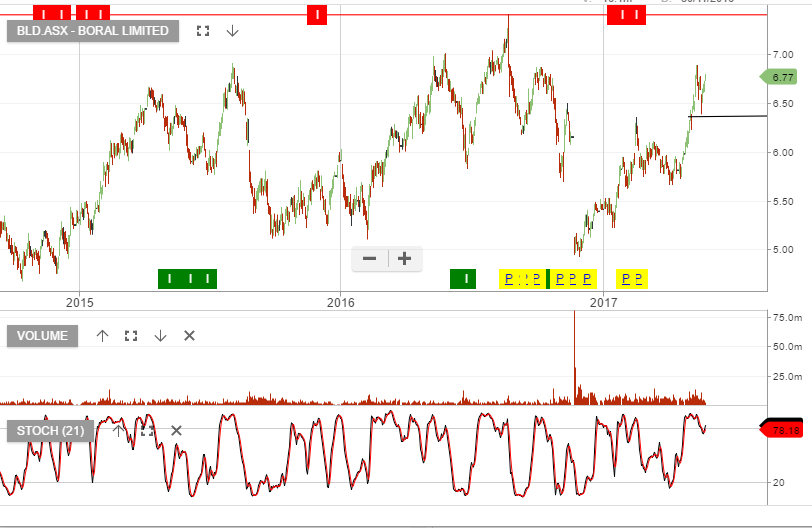
The market remains optimistic about future earnings growth for Boral. The recent Headwater acquisition in the US provides Boral with added exposure to the US housing market. Domestically, Boral is well placed to benefit from the an increase in large scale infrastructure projects.

We feel some caution is warranted though, given the weaker trends emerging is both US and domestic housing construction data. The stock trades on 19x forward earnings and less than a 4% yield.

FY18 revenue is likely to be $5.8b, EBITDA $1.15b, Net Profit $490m and DPS of $0.29.

Chart – BLD


Chart Watch – XJO Index

The XJO chart is showing the first lower low structure we’ve seen for some time.

The broader trend, which has been in place since  February 2016 is likely in the early stages of breaking lower. Any bounce higher from last week’s selling, is likely to be limited and investors should look to protect their portfolios.

New selling will likely occur within the range of 5790 and 5850, creating a lower high formation as a strong sell side signal.

Chart – XJO


Algo Buy Signal – Resource Sector

With the recent sell-off in commodity names, the Algo Engine has triggered buy signals in a number of big and small cap companies.

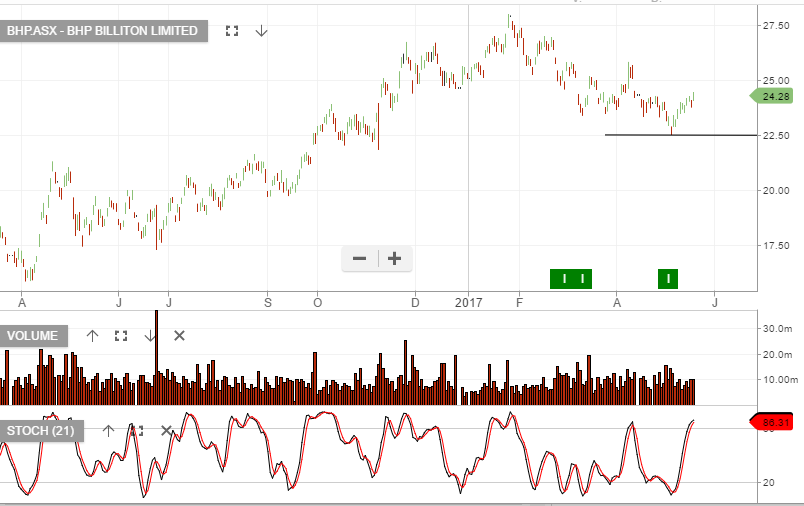
Our preferred resource allocation remains BHP, over other alternatives. However, it’s worth taking note of the recent buy signals in RIO, FMG, IPL and in OOO, the BetaShares Oil ETF.

We look to take profit in BHP at $25, after buying at or near $22.50.

Chart – Oil


Chart Watch – Goldman Sachs

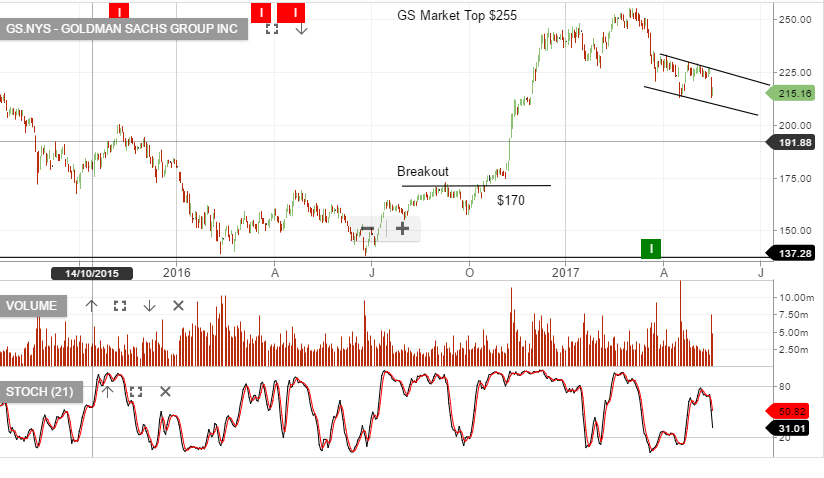
Goldman Sachs has sold  off $40 since the high created on the 1st of March. The chart image below shows price action is now finding minor support within a weakening short-term channel.

We’ll continue to watch the chart pattern unfold with anticipated resistance back up at $230.

The relevance of tracking GS for local investors, is it may provide an indication  as to when our local banking & finance stocks will find new selling pressure, should they have a minor bounce from yesterday’s lows.

Chart – Goldman Sachs