Telstra & Woolworths
Within a back drop of equity market volatility, Telstra and Woolworths look like a safe harbour for client portfolios.
We see 5 – 8% upside for capital gain plus upcoming dividends in Aug/Sep.

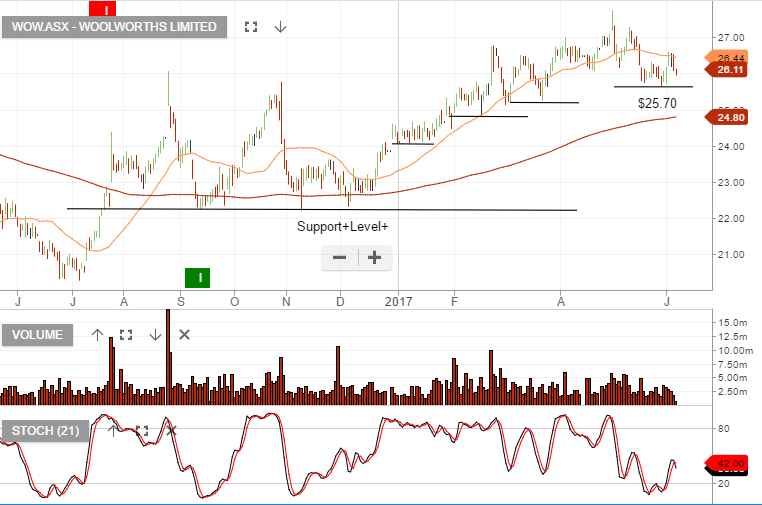
Within a back drop of equity market volatility, Telstra and Woolworths look like a safe harbour for client portfolios.
We see 5 – 8% upside for capital gain plus upcoming dividends in Aug/Sep.
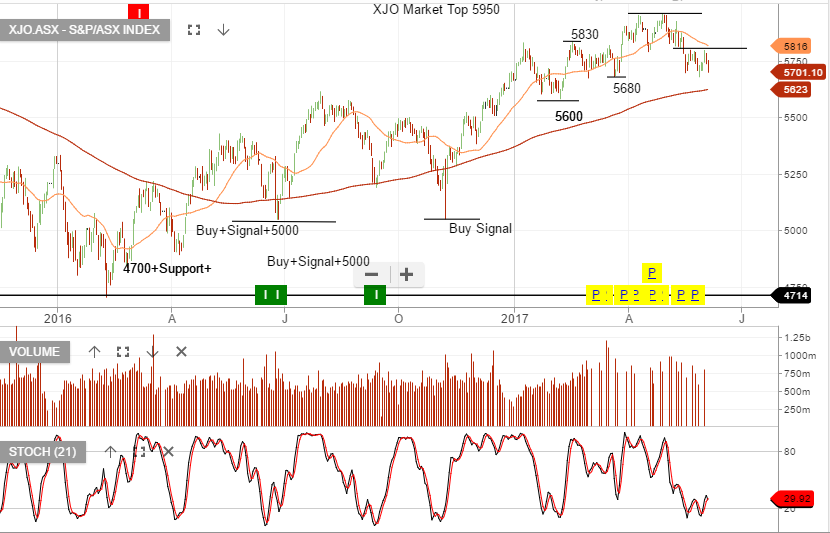
The XJO chart below shows the index breaking-down after finding selling pressure at the recent lower high formation on the 2nd of June.
The Dow Jones index continues to hold the higher low technical formation.
We review which stocks within the Dow Jones top 30 index are presenting relative strength, supported by our Algo Buy signals.
It’s time to take profit or sell tight covered calls in the following names:
Resmed, Treasury Wines, Transurban, Sydney Airports, Caltex, Ansel, Sonic Healthcare, CIMIC Group, Amcor, Brambels & Medibank.
Regular readers of the blog will recall the Goldman Sachs post we made on the 19th May 2017, (the post referenced the downward channel GS was tracking).
In the last few trading sessions, the stock rallied to the resistance within the channel and has now moved sharply lower in overnight trade.
Goldman Sachs was down 3.3% and was the worst performing Dow Jones stock in the overnight session. As the US reflation trade loses momentum, the bounce in the US financials has met renewed selling pressure at “lower high” levels.
The chart below shows Goldman Sachs’ sharp reversal.


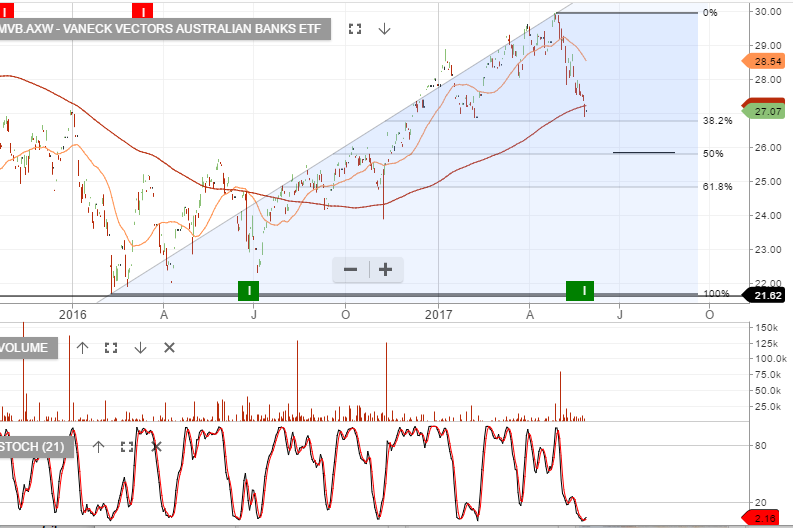
We’ve been net sellers of the banks and we continue to remain cautious. The probability of discounted rights issues, increasing bad debts, reduction of dividends and little or no revenue growth, hardly makes for a compelling investment case.
However, the chance of the washout being completed in one continued move lower, is low. Normally, we’d expect to see value investors step in at some point and create a more structured decline, with reasonable rallies within the broader downtrend.
With the above in mind, I’ve looked at the MVB Bank ETF and based on a 50% retracement, we’re now within 5% of the likely support area. Any bounce will be moderate and investors should again look to sell the rally.
Our Algo Engine will continue tracking the entry signals.
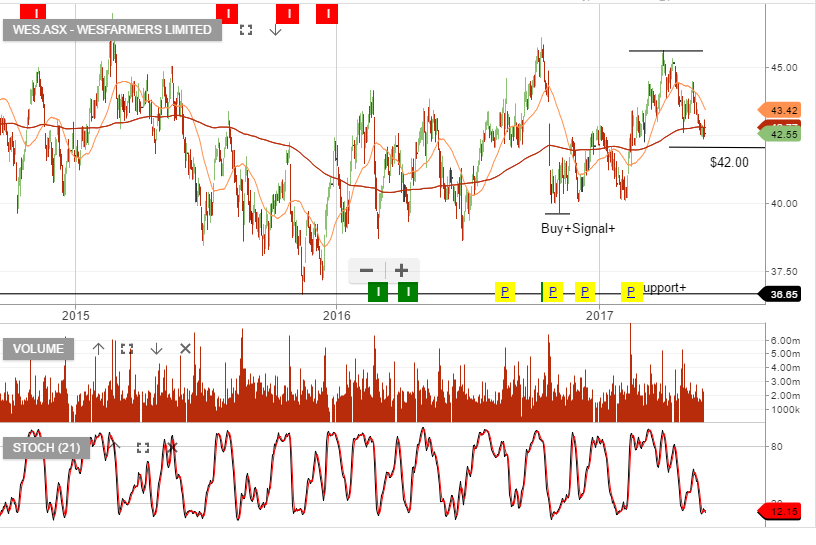
Wesfarmers will be providing a strategy briefing day on the 7th of June, it’s possible commentary from the presentation will add buy-side support to the stock price.
Our FY18 forecast revenue is $72b, EBIT $4.8b, EPS $2.82 & DPS $2.44, placing the stock on a forward yield of 5.7%.
Over the past 3 years any pullback in the share price to the $40- $42 range has provided a good entry level. Resistance or selling has occurred at or near $45.
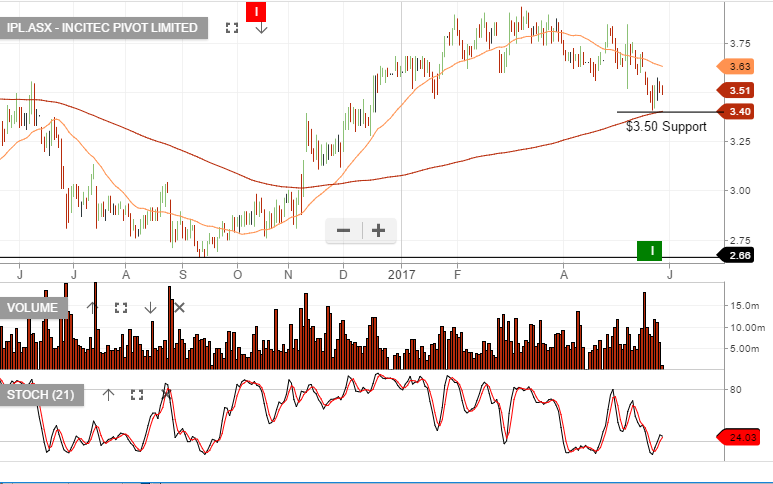
Our Algo Engine triggered a buy signal in IPL on the 23rd of May at $3.45.
The price action looks to have found support, at or near $3.50 and adding a long position with stops under $3.50 is worth considering.
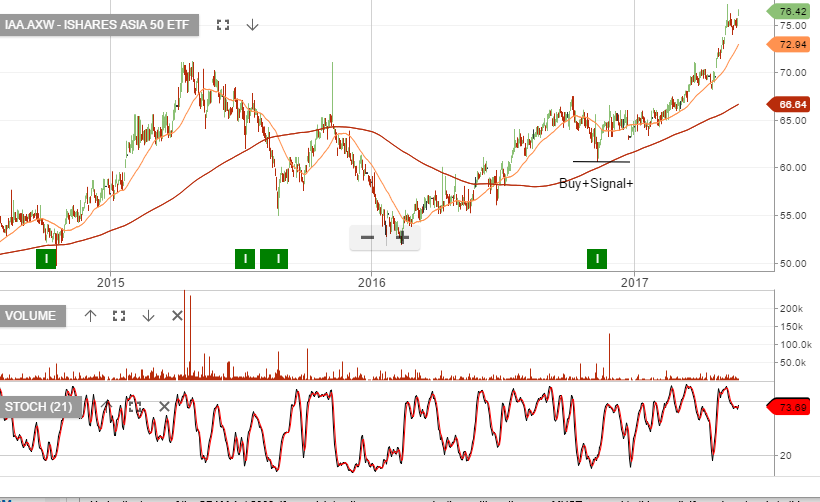
The ETF’s covered in this post are all ASX listed products, provided by iShares.
IAA covers the top 50 stocks in Asia. Our Algo Engine triggered a buy signal in November 2016 when the ETF was trading at $62, it is now trading $76
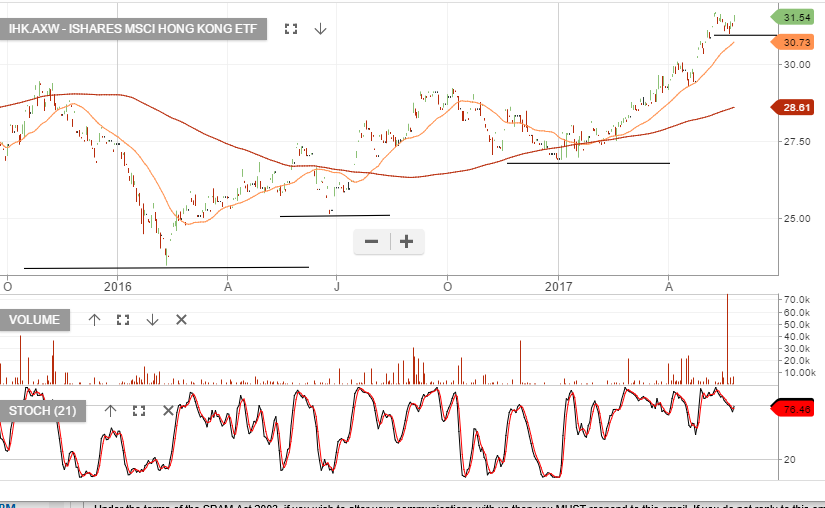
The chart below is the IHK – Hong Kong ETF
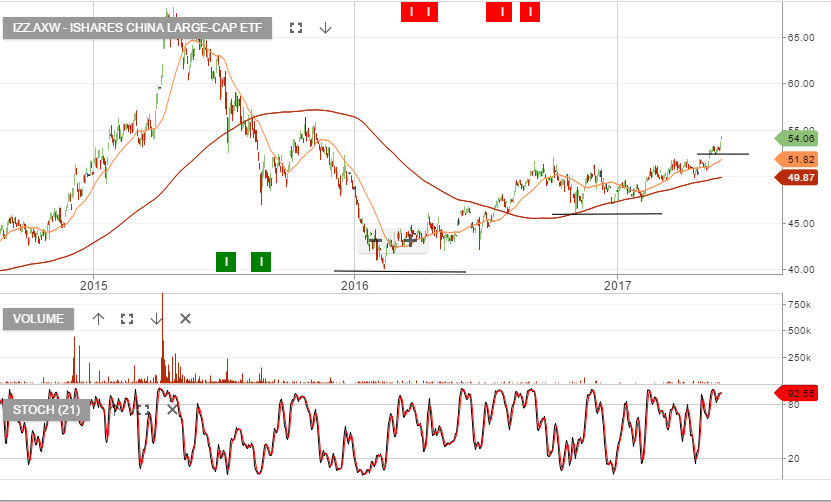
The Chart below is the IZZ – China Large Cap ETF
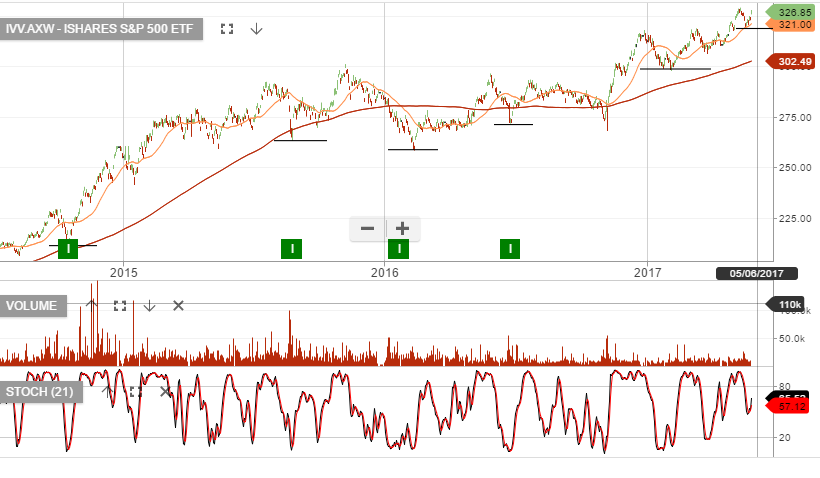
The IVV ETF is based on the S&P500 index in the US, the chart shows the market remains in a bullish higher low structure.
Investors continue to chase equity valuations higher as US GDP deteriorates.
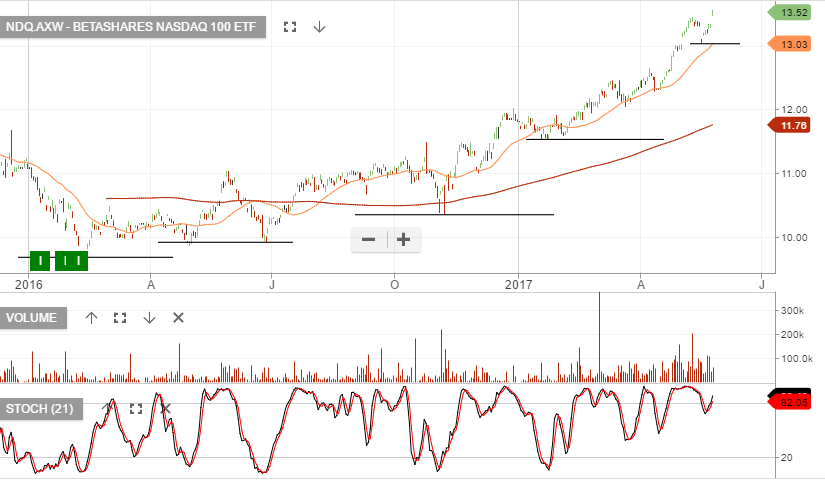
The chart below is the BetaShares NASDAQ 100 ETF. Our Algo Engine triggered a buy signal in early 2016 when the ETF was trading at $10, it is now trading $13.50.

Level 17 Chifley Tower
2 Chifley Square
Sydney, NSW 2000
1300 614 002
Investor Signals Pty Ltd
ABN 44 143 555 453