JP Morgan & General Electric

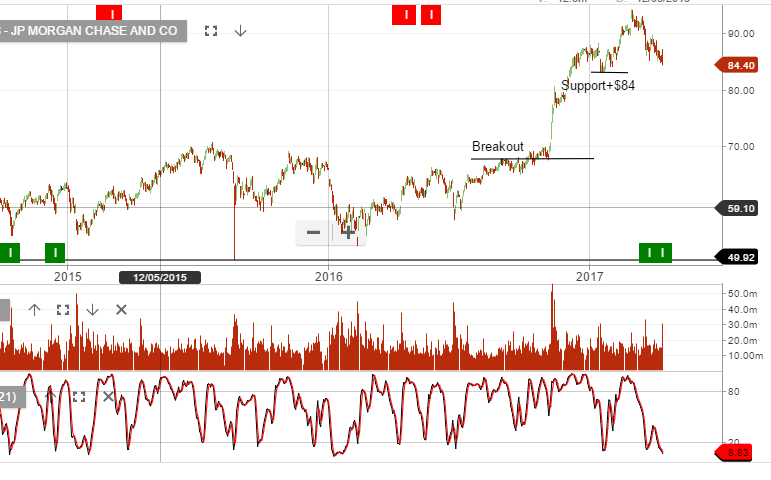
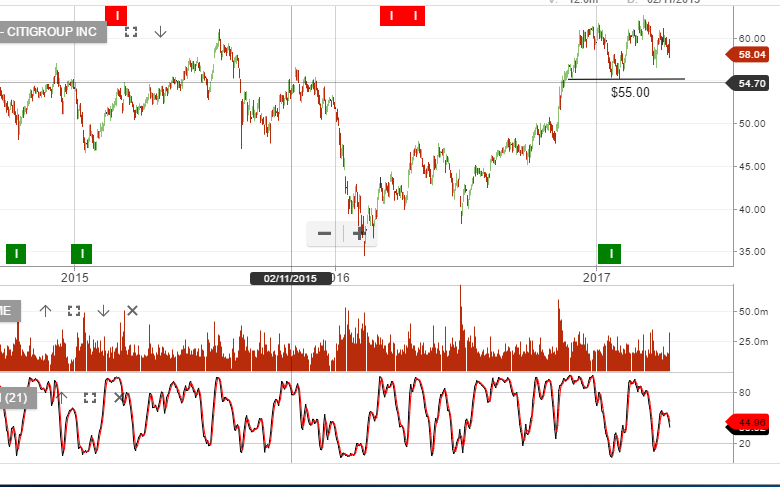
The following charts of Dow Jones’ large caps General Electric and JP Morgan, provide an interesting technical perspective of one of the world’s largest industrial conglomerates and one of America’s largest financial institutions.

GE reported late in the week and at first glance the headline number looked okay, but after digging deeper the free cash flow provided a concern and the stock sold off.

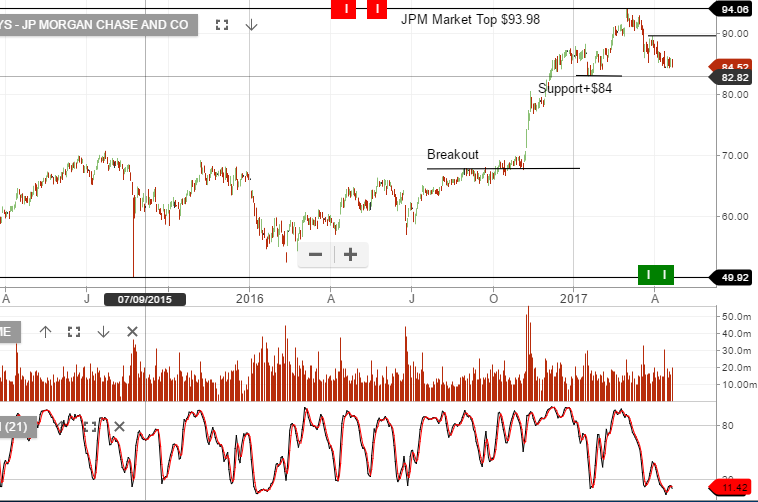
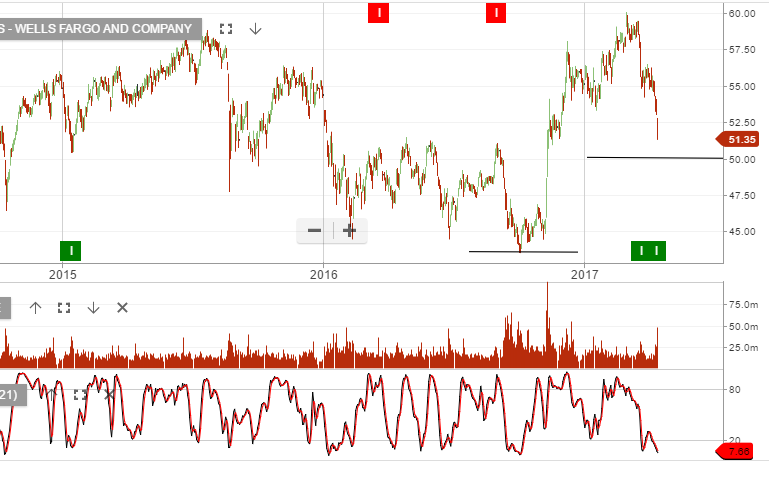
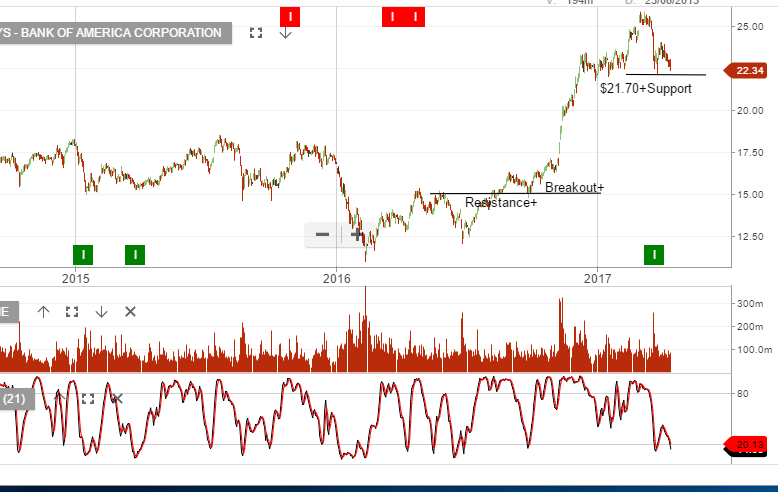
In the case of JP Morgan and other US banks, we’ve watched their share prices sell-off from the March highs as the long end of the yield curve flattens. The implication for banks is, a flattening yield curve will reduce their net interest margins.

US banks have now retraced on average 10%+ from their recent highs.
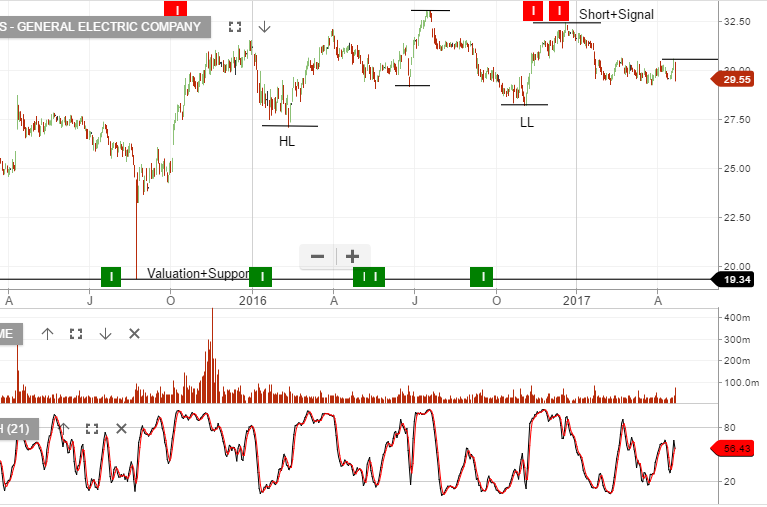
Chart – GE
Charts – JPM


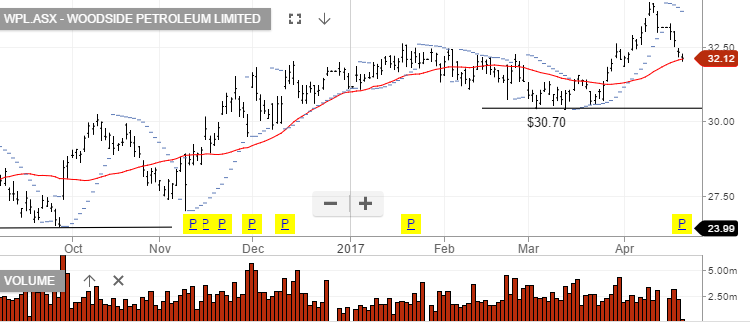
WPL – Q1-17 Production

Woodside’s 1Q-17 quarterly production was impacted by weather, with sales revenue down to US$895 vs US$1b in the December quarter of 2016.

Woodside is working on advancing Scarborough & Browse LNG projects. With the market assigning a minimal current value to these projects, they could provide longer term material upside to Woodside should it be successful in demonstrating the viability of the projects.

FY18 forecast EPS is likely to be similar to FY17 placing the stock on a forward yield of 4%.


Goldman Sachs – Q1 17 Earnings Result

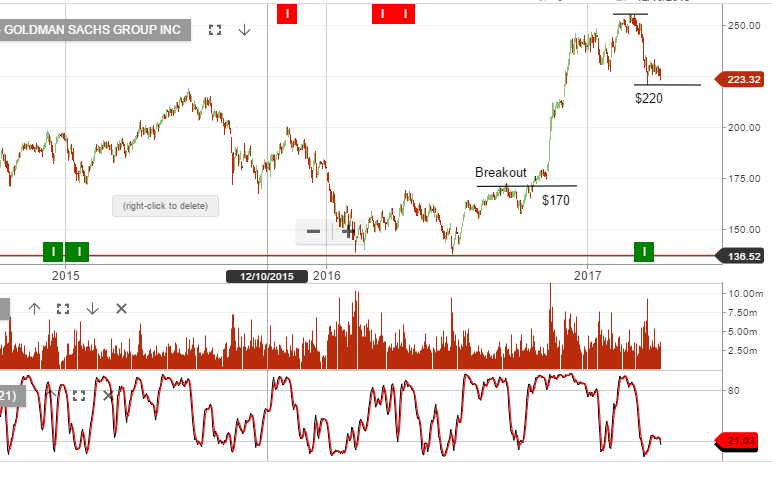
Goldman shares dropped more than 5 percent overnight to trade at their lowest since the end of November and are down 10 percent for the year so far. The US financials sector is about 1 percent lower year to date

Goldman Sachs reported 1Q earnings per share of $5.15 a share, missing a consensus estimate by 16 cents. Revenue came in short by about $420 million at $8.026 billion.

The last time Goldman reported a miss on earnings per share was the fourth quarter of 2015.

Technical buying support may start to build at or near $200.

Chart – Goldman Sachs


ASX Yield Sensitive Names Rally

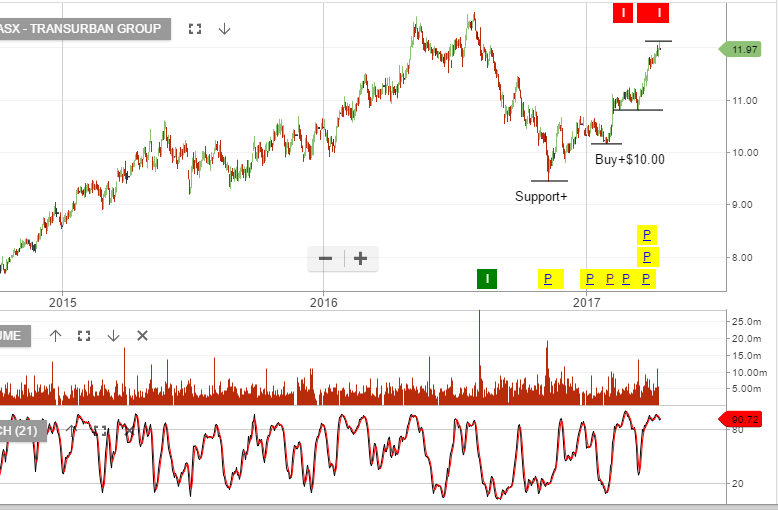
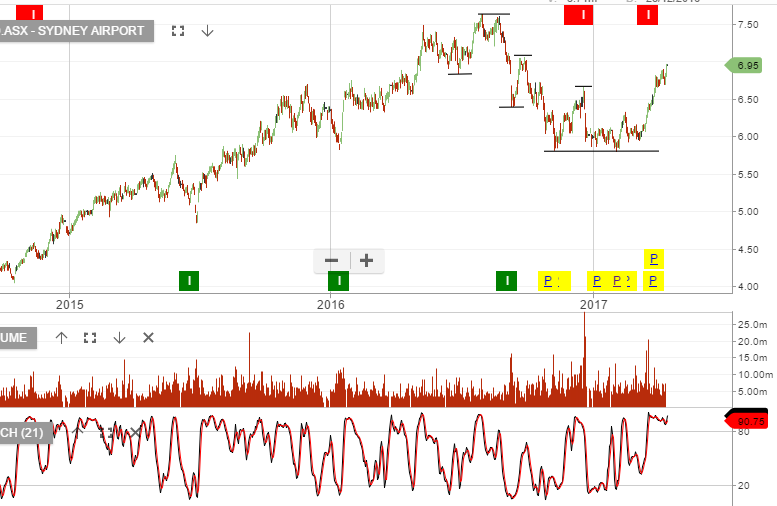
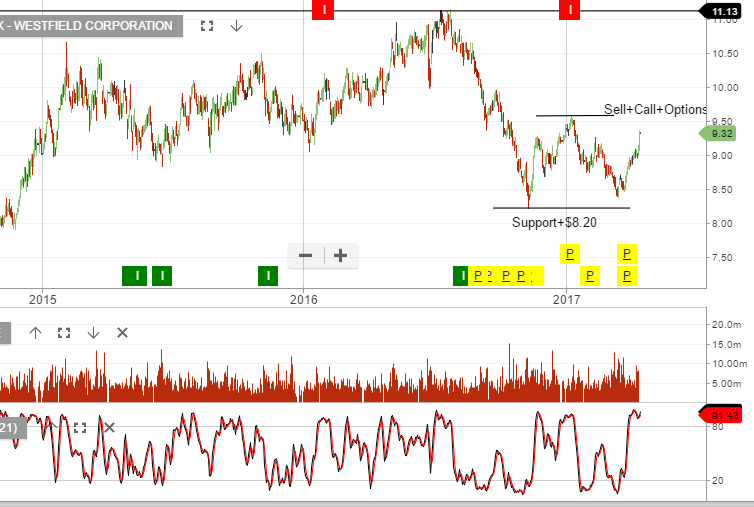
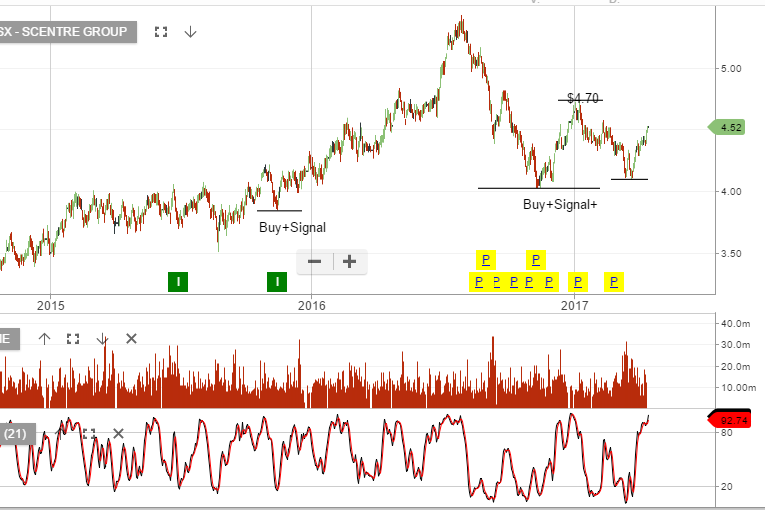
With bond yields moving lower in the US, we’ve seen strong buying interest in domestic yield sensitive names.

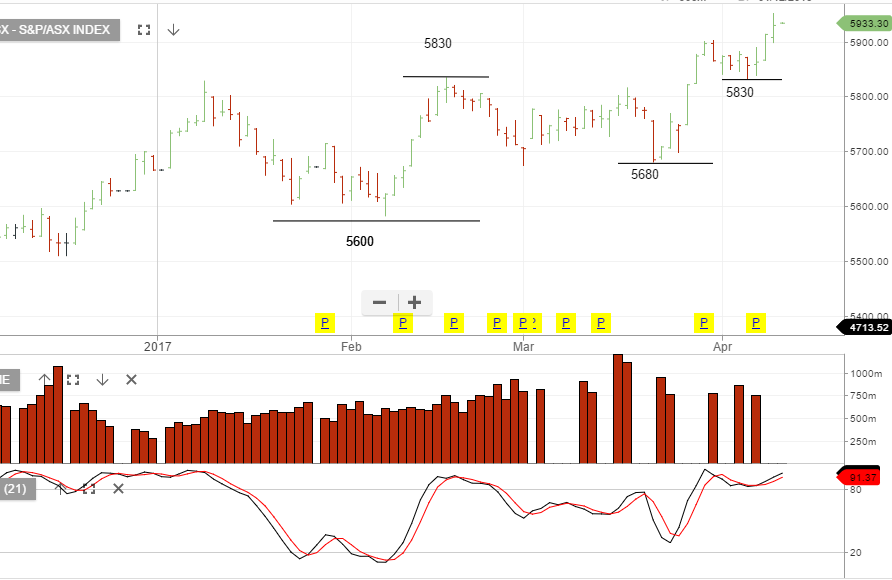
The rally is nearing the peak and taking profit  or selling tight covered calls is advised. History shows yields compressing below 4% will act as resistance for further share price advances.

Chart – TCL
Chart – SYD
Chart – WFD
Chart – SCG


Suncorp – Holding Support

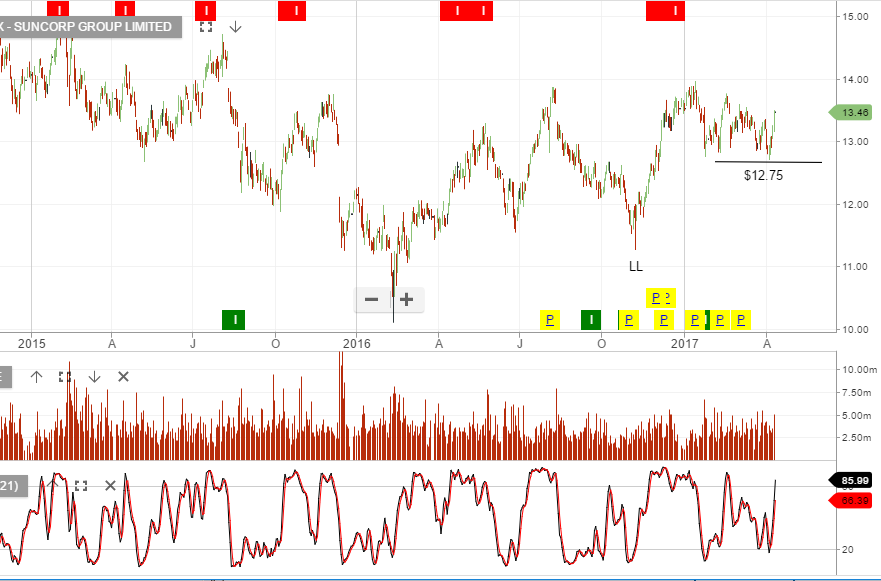
After a series of lower high structures over the past 2 years Suncorp looks to have found a short-term consolidation range with $12.75 support and $14 resistance.

We recently took profit in our long Suncorp exposure when the stock was last trading $13.75.  The stock is now back on our watch list but a break below $12.75 will show the downtrend remains the primary driver.

Chart – SUN