Coca Cola – How we’re generating 10%+ P/A

Coca Cola delivered  solid 2016 earnings result (+6.2%), which met market expectations. The announcement of a $350 million share buyback was  a positive surprise.

Structural pressures from shrinking CSD consumption will need to be off-set by continued cost out programs, such as the announced closure of the SA bottling plant.

A positive trend remains the growth in Indonesia/PNG, which delivered double-digit earnings over the past 12 months.

Looking into 2017, we expect revenue of $5.2billion, EBITDA $980m, EPS $0.58 and DPS of $0.48 placing the stock on a forward yield of 4.8%.

We own CCL in client portfolios and we’ve been selling tight covered call options to boost the cash flow to 10 – 12%+ on an annualised basis.
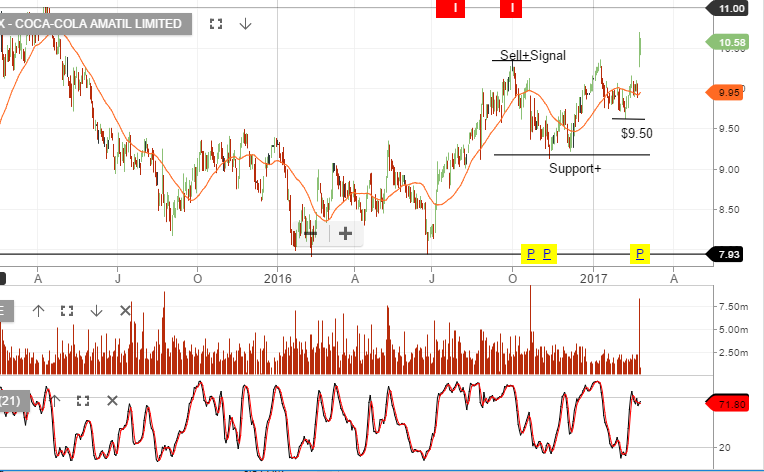
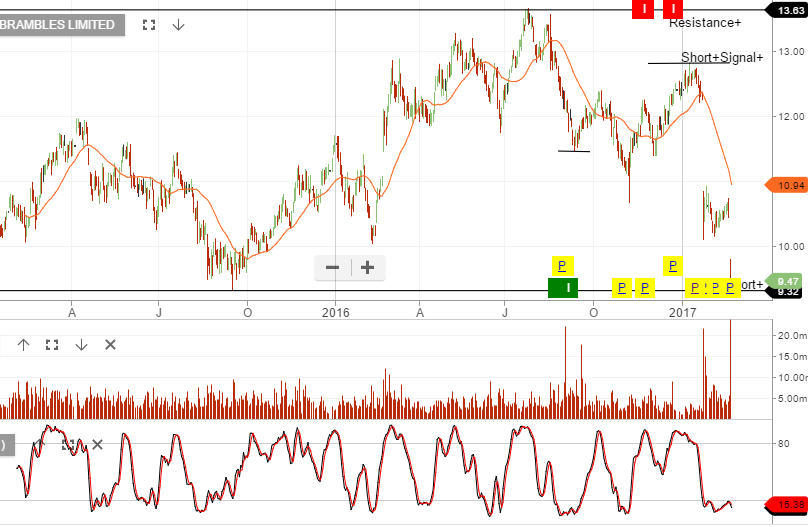
Chart – CCL


BXB – EBIT Should’ve Been Over $1 Billion

While BXB’s 1H17 result overall was below market expectations, the outlook for flat earnings growth in FY17 was much weaker than expected. FY17F EBIT was down  6% to US$950m.

The market was looking for stable EPS growth supporting an EBIT range of $1b – 1.1B over the next 12 to 24 months.  The $950 million figure is a substantial miss and the new consolidating share price range for BXB is now $9.25 to $11.00.

Setting the covered call strategy at a more aggressive level will help to drive returns here, we look to lower the call strike and see $10.25 calls as an effective level.

Chart – BXB


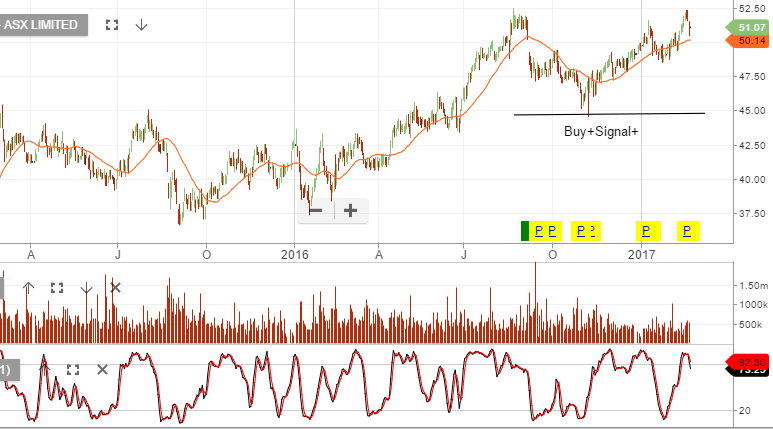
ASX- Valuation Review

Following the recent 1H17 earnings update, we will take  a look at establishing fair value for the ASX.

1H17 NPAT of A$219m represented 3% underlying earnings growth. Moderate revenue growth occurred across most major ASX activities.

Here is the issue: the stock trades at 22x forward earnings on a 3.9% dividend yield. The earnings are stable but the stock is expensive. And whilst ASX delivered 3% revenue growth in 1H17, this is down on the 6% average level achieved over the last 3 years.

Our conclusion on fair value is; buy ASX on a pullback to $47 or a 4.5% dividend yield.

Chart – ASX


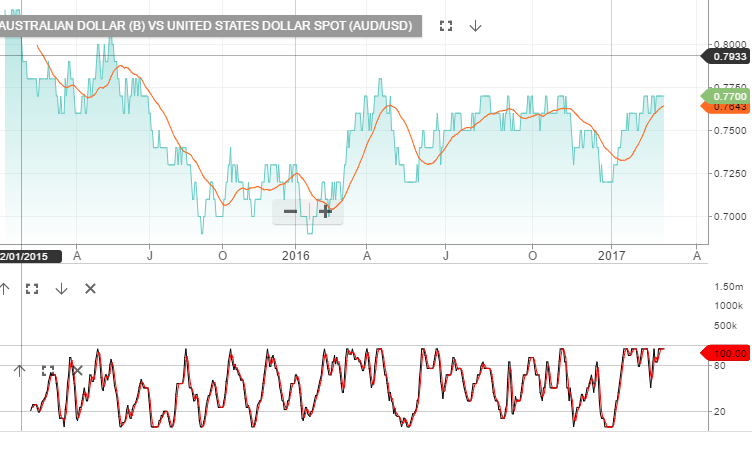
Australian Jobs Growth Data

Full-time jobs growth has slowed since 2013.

Slowing in full-time jobs growth is primarily due to job losses in the mining and manufacturing sectors with full-time job losses concentrated in the mining-dominated states of WA and Qld.

More recently though, full-time jobs growth has also reportedly stalled in NSW.

The latest employment data reported a loss of 44.8k full-time jobs in January, offset by a 58.3k rise in part-time jobs.

Chart – AUD vs USD


China & Our “Risk” Scenario

Chinese foreign exchange reserves dropped below $3 trillion in January for the first time almost 6 years. That’s down from $4 trillion in 2014.  The drop is largely caused by the Chinese central bank  intervening in the FX market as they buy yuan to prop-up the currency against the US dollar.

Overseas direct investment from China fell by 35% in January, compared to a year ago & Chinese investment in overseas property dropped by 84%.

Over-inflated Chinese property prices and the risk of their property bubble bursting, is a concern. We’re tracking resale data in the major cities and there’s evidence of price declines emerging since November of last year.

These are trends we’re watching closely as they form the basis of our “risk” scenario for global equities, especially given the gap between forward PE valuations and probable 2017 earnings growth.

China – iShares China Large CAP ETF


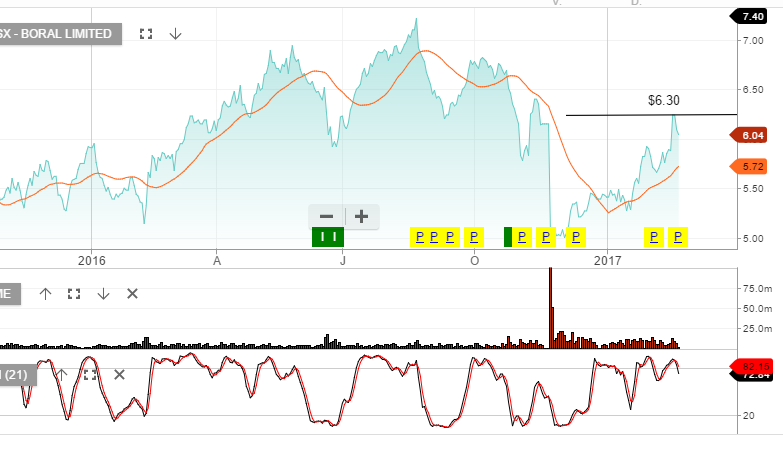
Boral – Chart Review

Boral has created a negative pricing structure following the stock making a lower low and then a lower high at $6.35 in last week’s trading.

With our general concerns around both domestic and US housing construction trends, combined with Boral’s  high valuation and moderate underlying earnings growth, we think this is worth keeping on your “short signal” list.

Chart – BLD


Banks – Chart Update

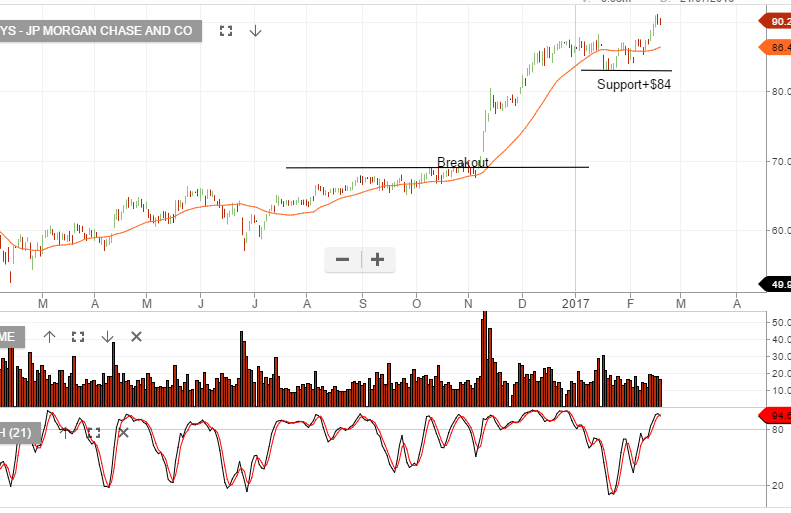
US banks, (see chart below of JP Morgan), are breaking to the upside of their recent consolidation range, and this is likely driving the rebound in the share price of the Australian banks.

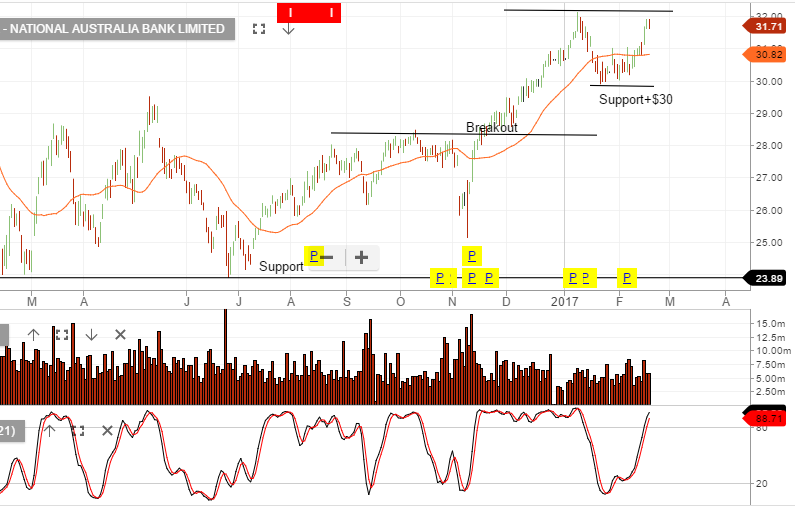
NAB reported a 1% fall in earnings following weak revenue growth and a pickup in expense growth. Bendigo Bank failed to deliver growth at the top or bottom line.

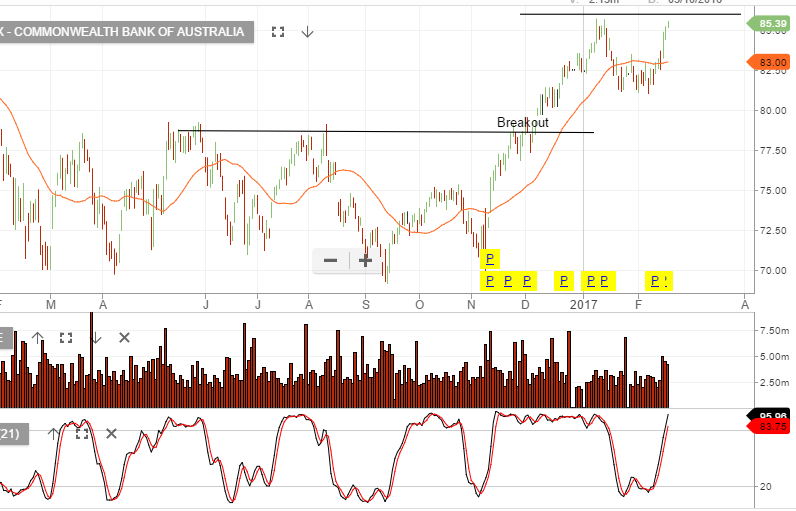
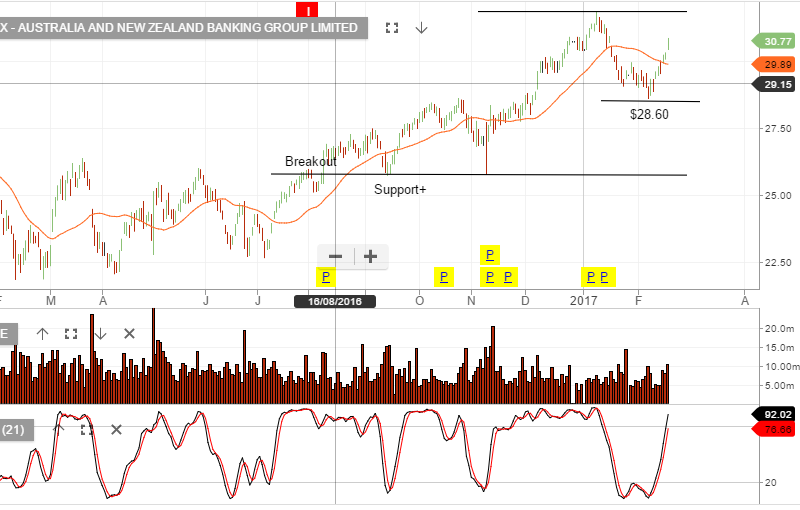
CBA reported slightly ahead of expectations with underlying profit growth of 2.8% or $4.9b for the half. ANZ’s quarterly update, (released Friday), reported a 31% rise in profits to $2b for the 3 months to December.

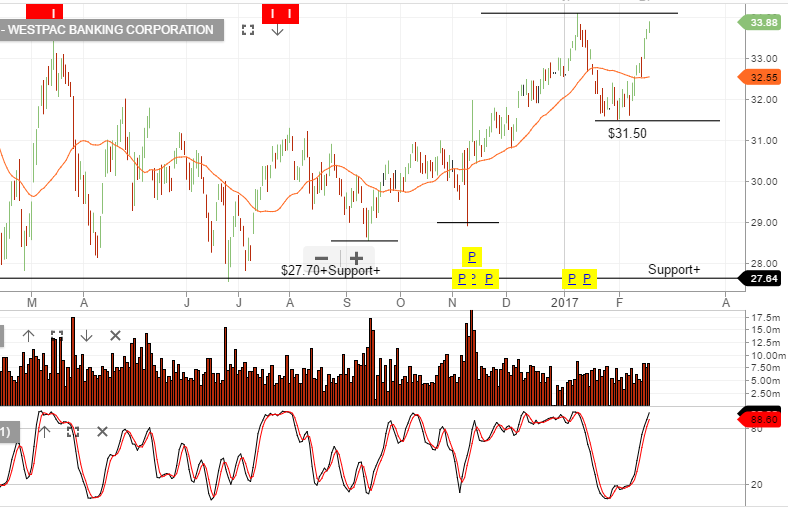
Across all banking results, the NIM or net interest margins, remain under pressure, as does top line revenue growth. These are the same concerns which caused the 10% sell off in banks at the start of this year.

We’ll watch with interest how prices behaves in both the XJO and our major banks this week, as we commence trading with price levels similar to the peak of early January.

Chart – CBA
Chart – ANZ
Chart – WBC
Chart – NAB
CHART – JPM


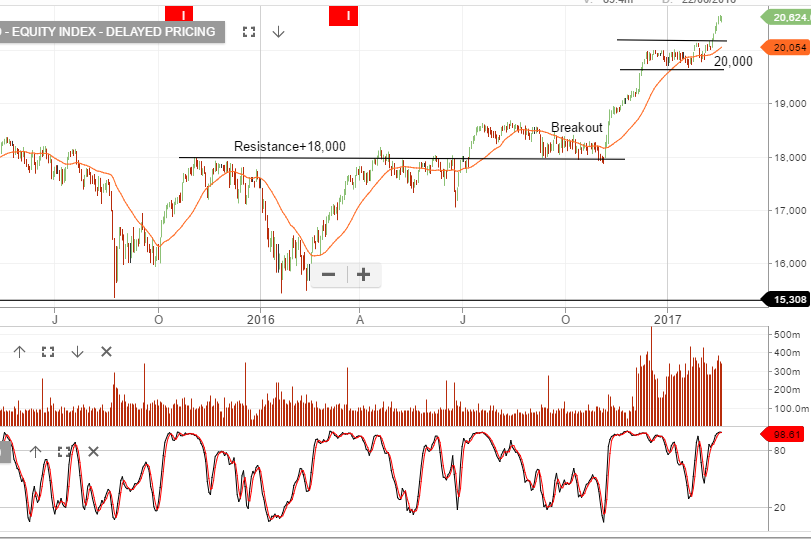
XJO – Chart Update

On the 7th of February the XJO index created a new higher low formation as buying support returned and the index rallied from the 5582 low, back to retest the trend high on Friday, when the index closed at 5805.

Currently, ASX 200 stocks which have reported, show an average revenue growth of 3.2% and underlying earnings per share growth of 6.5%. This is the first return to earnings growth in 3 years.

Chart – XJO